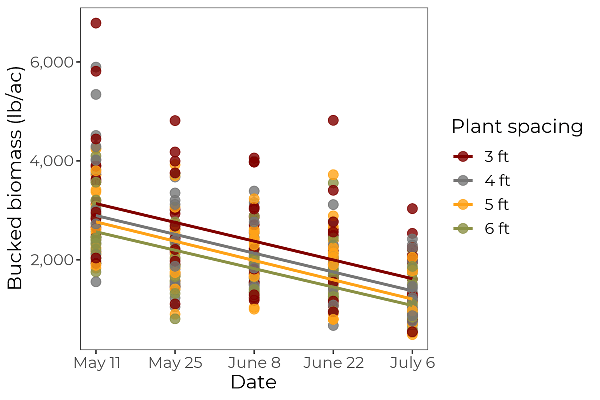
Figure 6. Yields per acre affected by transplant date and plant spacing.
A graph of yields per acre at different plant spacing with date on x axis, bucked biomass on y axis.