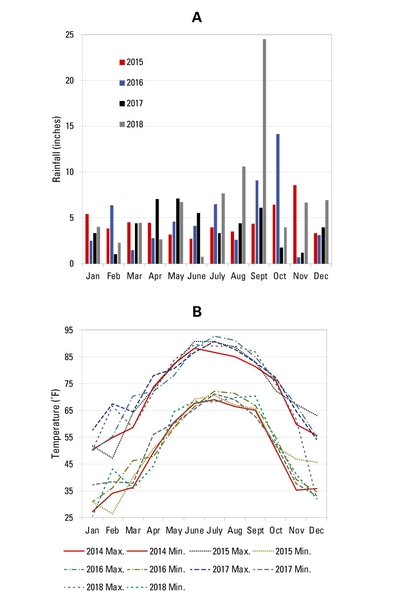
Figure 6. (A) Temperature and (B) rainfall data for the CEFS silvopasture in Goldsboro, North Carolina.
(A) Bar graph of monthly rainfall (inches) for silvopasture in Goldsboro, NC, 2015 to 2018. (B) Line graph of maximum and minimum monthly temperature (Fahrenheit) for same.