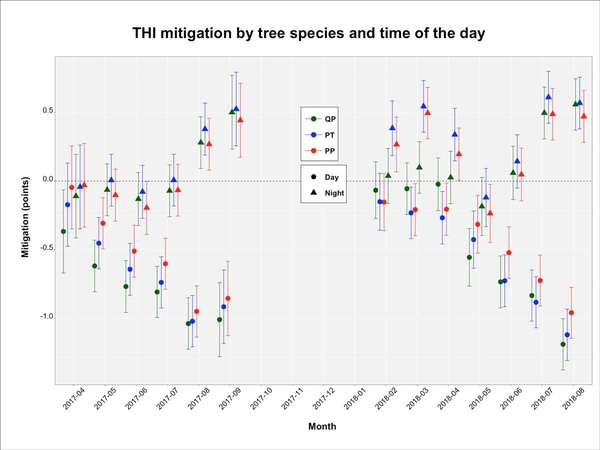
Figure 10b. THI mitigation (B) by tree species (QP = Quercus pagoda, PP= Pinus palustris, PT = Pinus taeda) as a function of time of day and month of the year in the same location and years. Data are mean values with error bars reporting 95% confidence intervals.