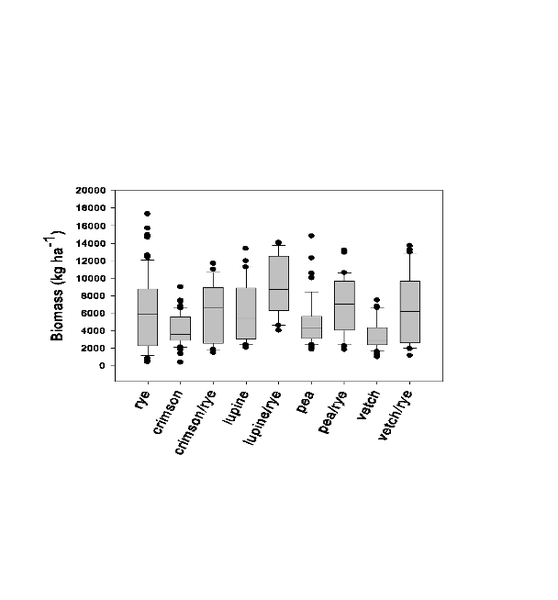
Figure 11-5. Productivity of legumes and legume-cereal mixes in the Southeast from 2008 to 2010. Figures come from a pooled analysis of trials in Georgia (GA) and North Carolina (NC).