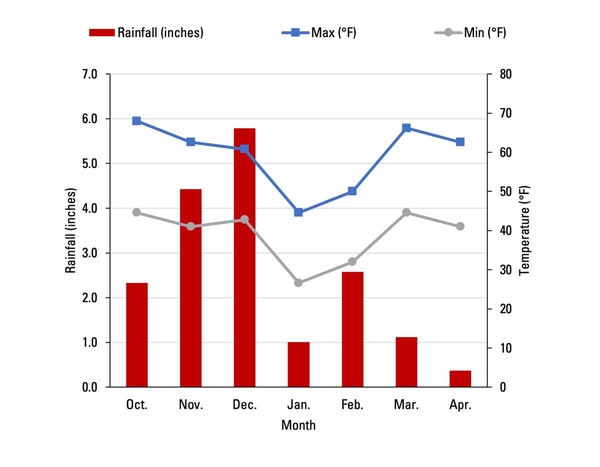
Figure 1. Rainfall and temperature during the experimental period in Roxboro, NC.