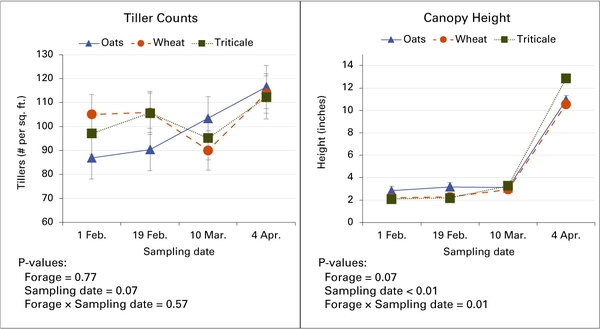
Figure 3. Tiller counts and canopy height dynamics, on-farm demonstration trial