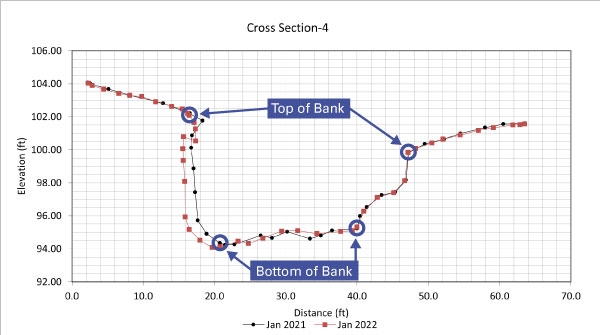
Figure A.1. Example of plotted overlays of cross-section data from two surveys with selection of top and bottom of bank elevations.
Graph of distance on x-axis (0–70 ft) and elevation on y-axis (92–106 ft). Two lines show streambank cross-sections with top and bottom of banks labeled for January 2021 and 2022.