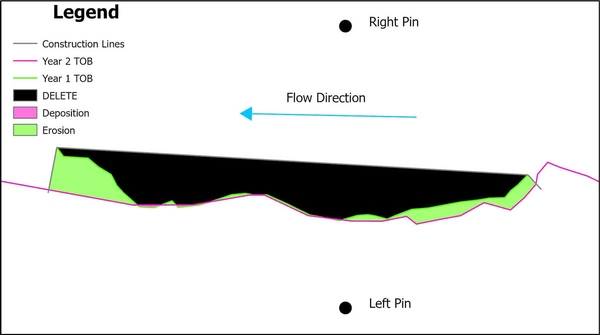
Figure B.3. This shows the Year1_Year2_change polygon and which sections of the polygon are erosion (green), which are deposition (pink), and which should be deleted (black).