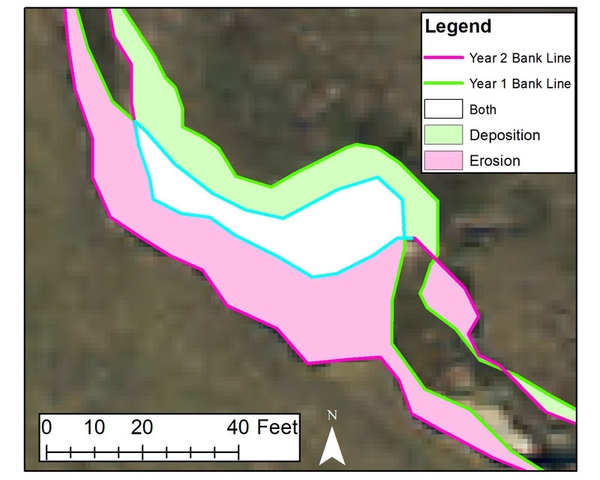
Figure C.2. Polygon between old and new channels that represents both deposition and erosion.
ArcGIS map showing the creation of a polygon representing the area of erosion and deposition between the 2007 and 2019 channels.