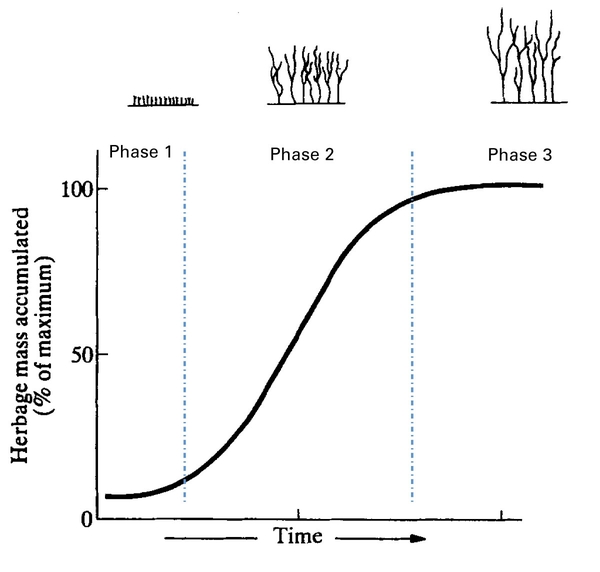
Figure 3. Forage mass accumulation during a regrowth recovery period. Phase 1: low accumulation rate, Phase 2: high accumulation rate, and Phase 3: little or no net accumulation rate due to balance between new growth and senescence of plant tissue.

Adapted from Hodgson, 1990; Saul and Chapman, 2002.