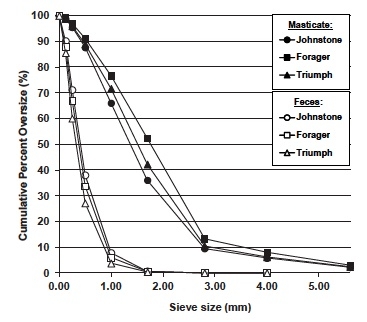
Figure 1.1. Dry matter distribution of masticate (Experiment 1B) and fecal particle sizes (Experiment 1A) from Johnstone, Forager, and Triumph tall fescue hays.