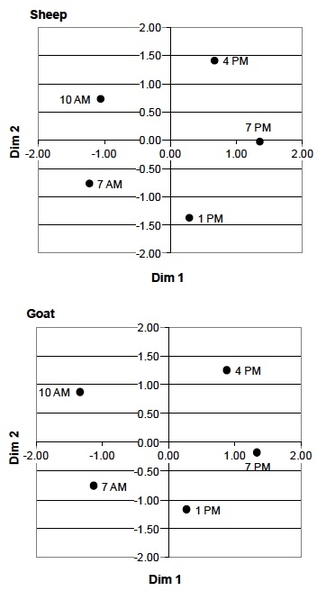
Figure 9.1. Animal preference expressed in two dimensions of separation among the five experimental forages.