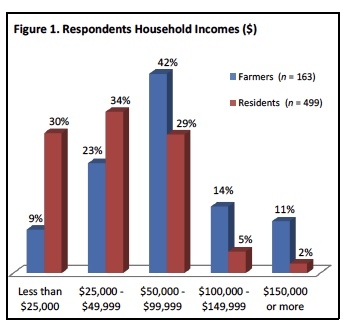
Figure 1. Respondents Household Incomes ($)
Bar graph with bars for farmer income vs. residents income at intervals from less than $35, 000 to $150,000 or more.