Figure 8. Climate-maturity groupings based on optimal mean growing season temperatures in the world’s benchmark regions. Adjustments to these ranges may occur as more data become available. Changes of more than +/-0.4°F to 0.8°F are unlikely.
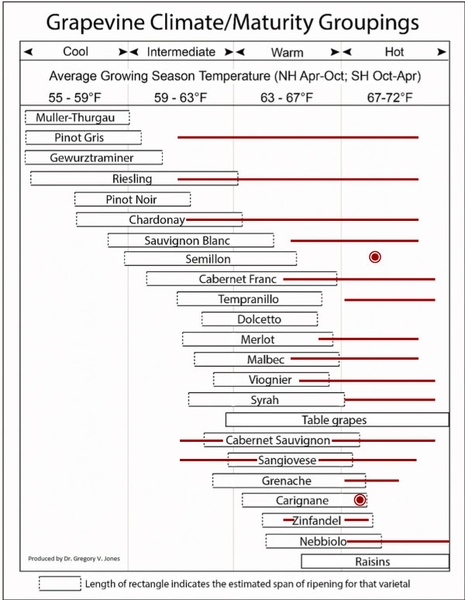
Used with permission of Dr. Gregory Jones.