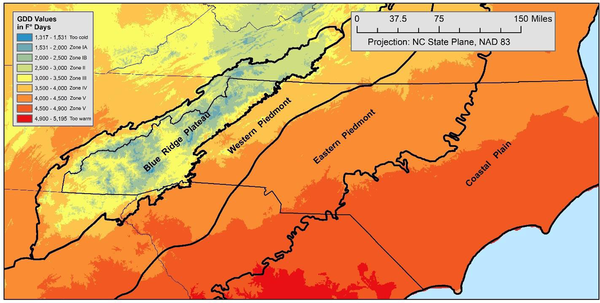
Figure 10. Growing degree day zonation. Temperature data from the Prism Climate Group gridded 1991 to 2020 climate normals.