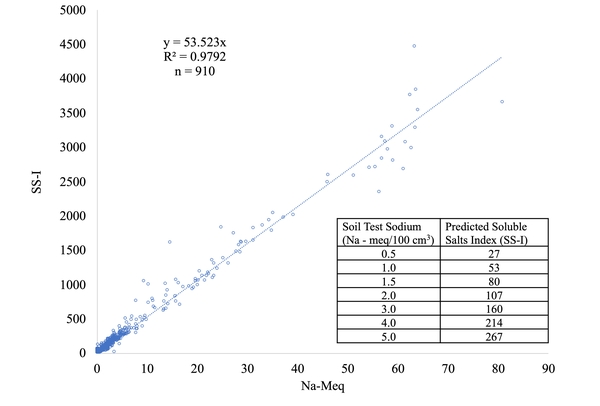
Figure 2. Soluble salts index as predicted by soil test sodium concentrations. Based on this relationship: SS-I = 53.523 (sodium), R² = 0.9798, n = 910.
Data compiled by David H. Hardy, NCDA&CS, Agronomic Division, 2024.
Data compiled by David H. Hardy, NCDA&CS, Agronomic Division, 2024.