Figure 2. The influence of bedding and fertility treatments on the dry biomass yield of floral hemp. Dry biomass was calculated by averaging end-of-season bucked samples. Results include combined data; years × location.
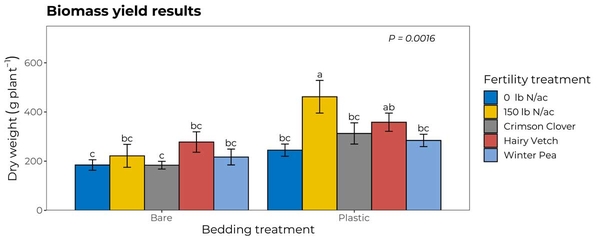
Means followed by the same letter are not significantly different (p > 0.05) and represent the average of three subsamples × four replicants × five environments (n =60).