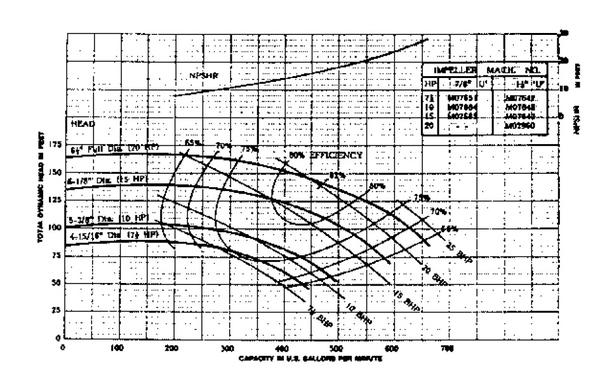
Figure 6. Typical pump characteristic (performance) curve for a motor-driven pump. There is a narrow range (shaded area) of pressure and volume within which the pump will perform at maximum efficiency.