Figure 1. Best-fit trend lines of total heat production using data collected from several different studies (both toms and hens) for a temperature range of 59°F to 86°F for genetic lines from two periods.
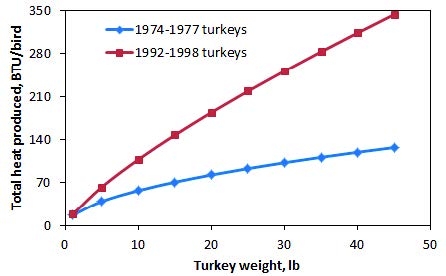
Source: Chepete and Xin, 2002