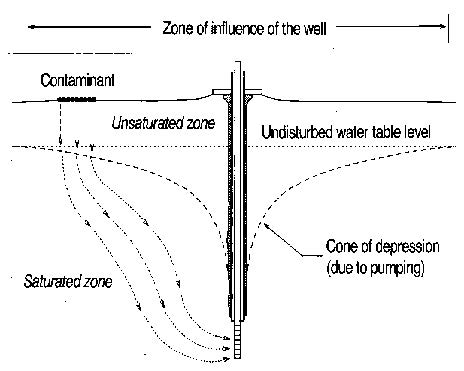
Figure 2. Cone of depression and path of contaminant to well.
Illustration shows Zone of influence of the well, contaminant, unsaturated zone, saturated zone, undisturbed water table level, and cone of depression (due to pumping)