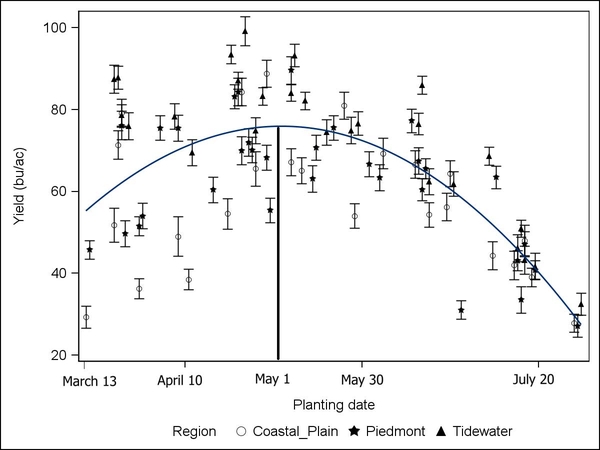
Figure 5-5. Soybean yield response to planting date combined over MG and seeding rate in 15 North Carolina soybean production environments from 2019 to 2023. Each dot represents an individual environment by planting date combination.