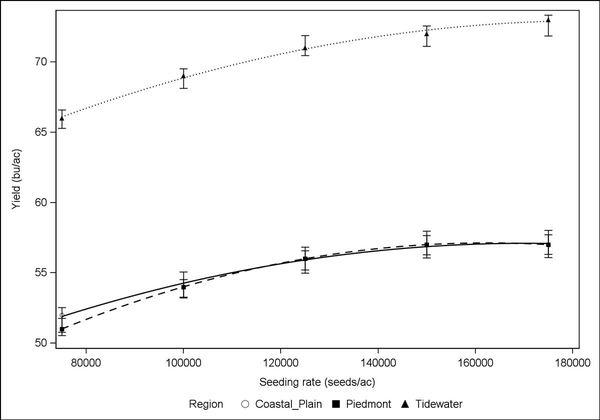
Figure 5-9. Soybean seeding rate impact on yield (combined over planting dates, maturity groups, and 15 North Carolina environments) in the coastal plain, piedmont, and tidewater regions.