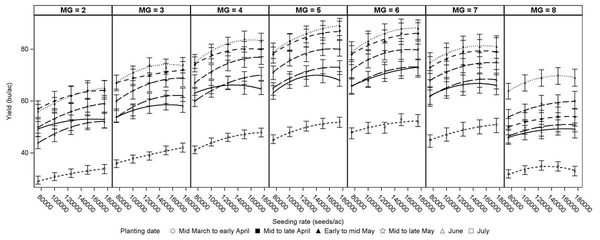
Figure 5-10. Seeding rate impact on soybean yield across planting dates for each MG combined over 15 North Carolina environments.