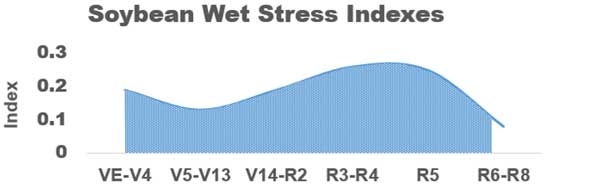
Figure 10-2. Soybean crop-susceptibility index factors for wet stress by plant growth stage.
Graph showing soybean wet stress at different growing stages, with stress declining from VE-VE4, rising from V13-R4, and then declining again.