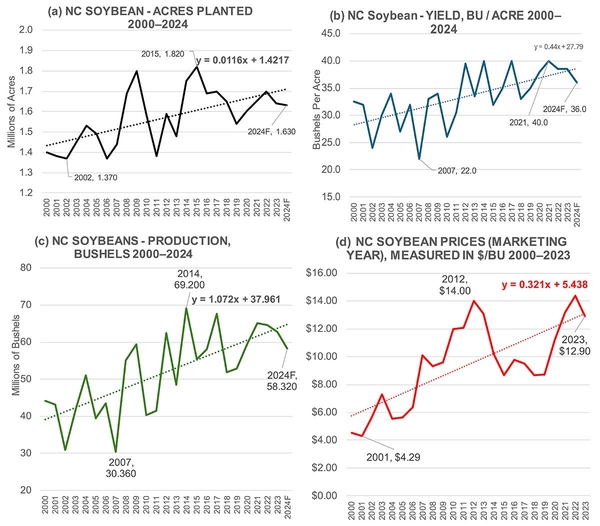
Figure 12-6. North Carolina Soybean Acres, Yield, Production, and Prices
Four graphs showing acres planted, yield, bushel production, and prices trending upward from 2000 to 2024.