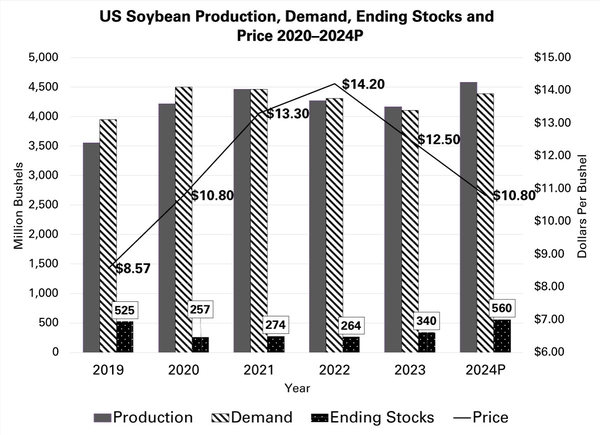
Figure 12-7. U.S. soybean production, demand, ending stocks, and price 2020–2024P.
Graph showing production, demand, ending stocks, and price from 2019 to 2024 (projected).