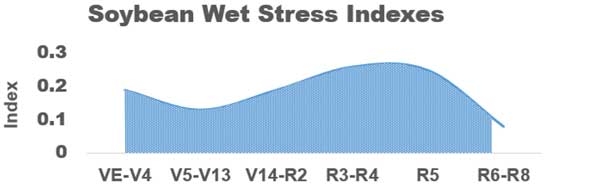
Figure 2. Soybean crop susceptibility index factors for wet stress imposed at different plant growth stages (Evans et al. 1991).
Graph showing soybean wet stress at different growth stages, with stress declining from VE to V4, rising from V13 to R4, and then declining again.