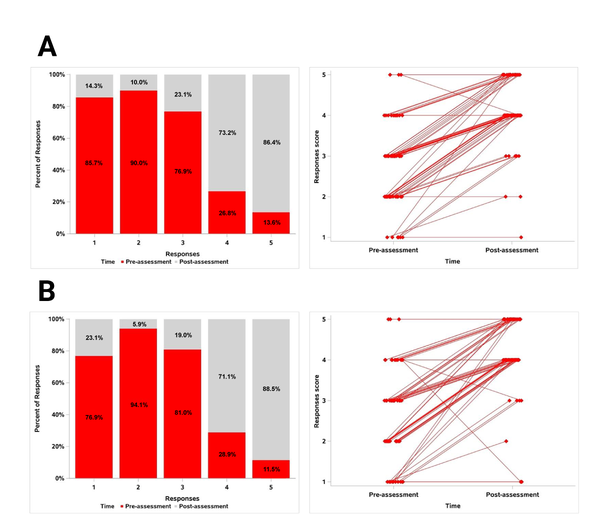
Figure 4. Participants' perceived pre- and post-workshop knowledge, where scores range from very low (1) to very high (5) in topics related to selection and mating decisions (Panel A) and breeding season management (Panel B).