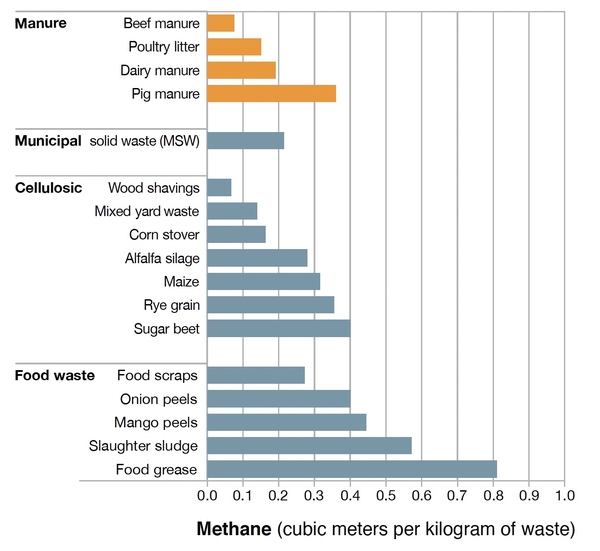
Figure 2. Methane yield per kilogram of dry material of some common organic inputs to produce energy.
Adapted from Moody et al. 2011 and Appels et al. 2011