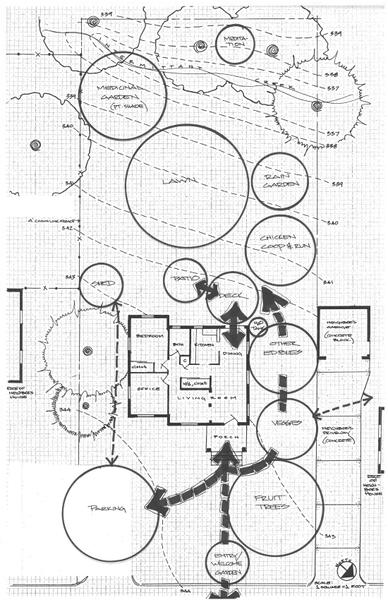
Figure 19–21a. The bubble diagram is for determining the best size and location for wanted elements and traffic patterns. Figures 19–21b-d play with the SHAPES. Notice all the bubble elements stay in the same place, and stay fairly consistent in size.

Anne Spafford