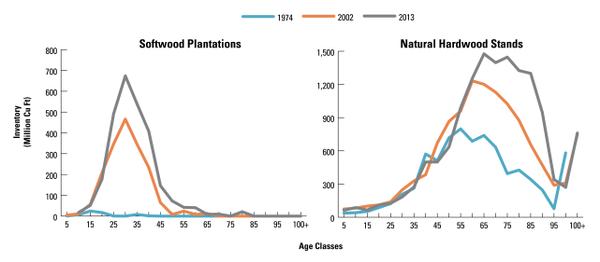
Figure 4. Forty-year shifts in growing stock sawlog inventory by species group, age, and stand origin.
Graph of softwood plantations,  age classes vs. inventory (million cu ft),  and graph of Natural hardwood stands, age classes vs. inventory for 1974,2002 & 2013