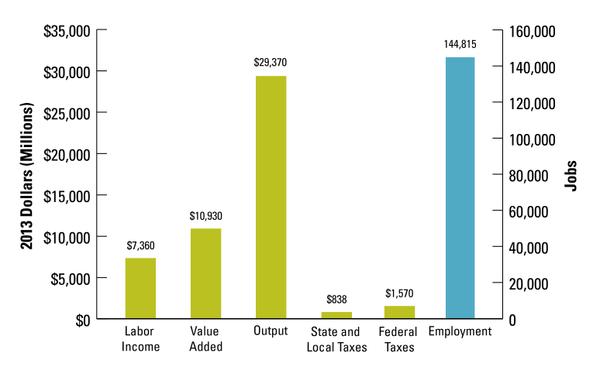
Figure 9. Total economic contributions of forestry and forest products in North Carolina.
Bar graph of economic contributions (i.e. labor income, value added, output, taxes, employment)