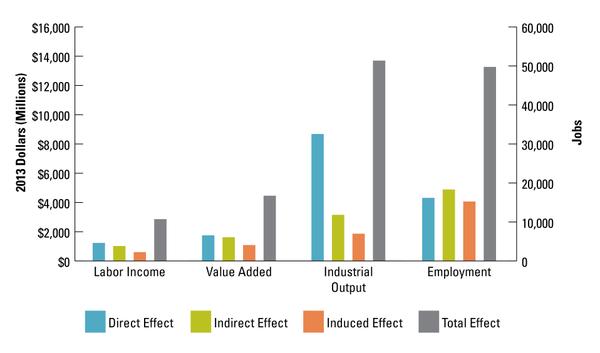
Figure 12. Contributions of paper manufacturing to North Carolina’s economy.
Bar graph compares direct, indirect, induced and total effect contributions of paper manufacturing to NC economy.