Figure 8. Southeast annual and summer season temperature anomalies from the National Climatic Data Center.
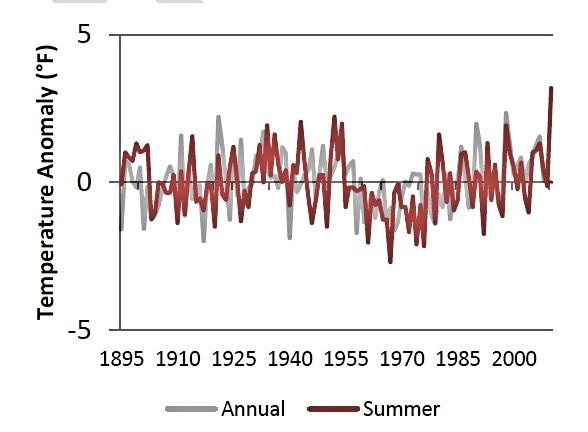
Image from Draft: Southeast Region Technical Report to the National Climate Assessment
Image from Draft: Southeast Region Technical Report to the National Climate Assessment