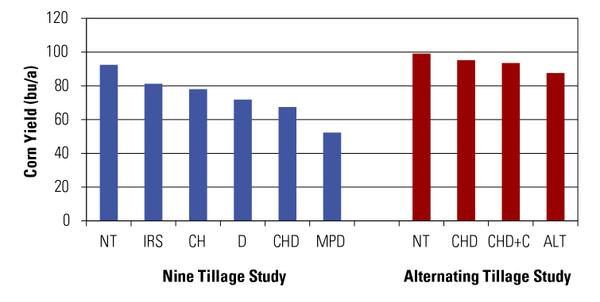
Figure 1. Average corn yields in the Nine Tillage Study (blue) and the Alternating Tillage Study (red). Averages calculated over 14 (Nine Tillage) or 13 (Alternating Tillage) years of harvest data.