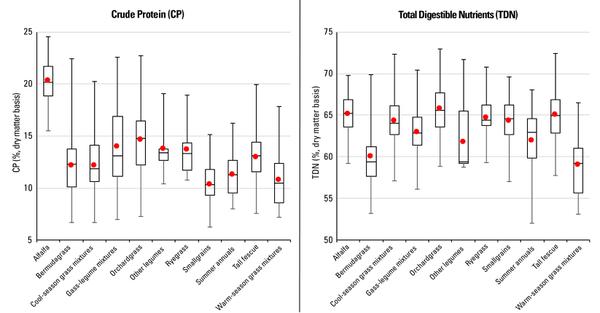
Figure 3. TDN is based on acid detergent fiber equations used by the laboratory. Samples submitted to the N.C. State Fair Forage Contest from 1996 to 2015. Red dots represent average concentrations; error bars represent the maximum and minimum values.