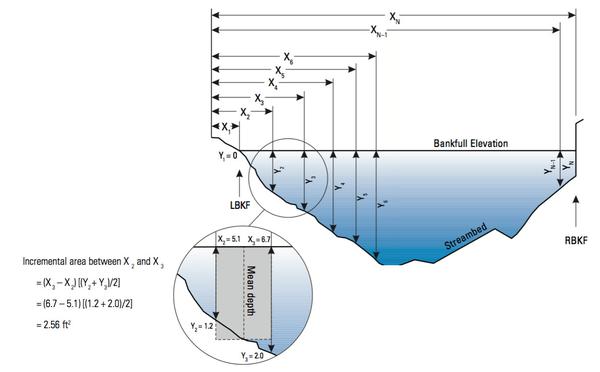
Figure 4. Xi represent cross-section distances (widths) from left pin. Yi represents location & reading of a bankfull depth. Dashed line equals the calculated mean depth for a section. Shaded rectangle shows example of sectional area.