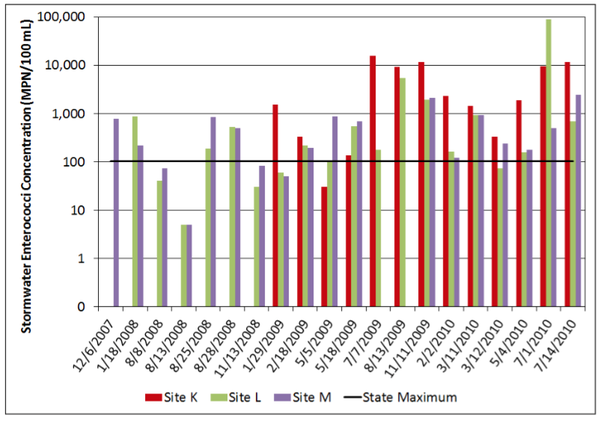
Figure 8. Concentrations of the fecal bacteria indicator enterococci in stormwater samples entering the DISs at Kure Beach. Values indicated on the y-axis are on a logarithmic scale. Samples from the K avenue site were available beginning in 2009.