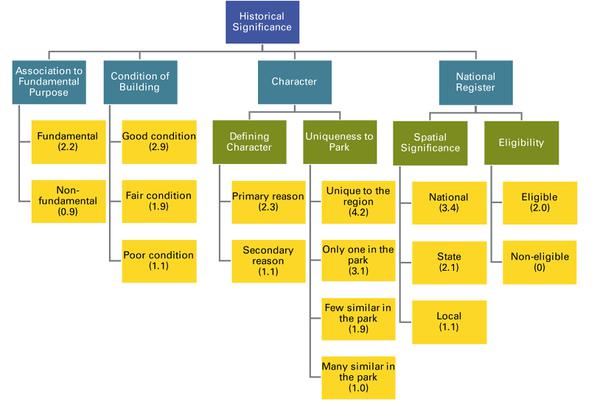
Figure 2. Diagram of historical significance with its attributes (in light blue boxes), sub-attributes (in light green boxes), and associated metrics with means scores (in yellow boxes).