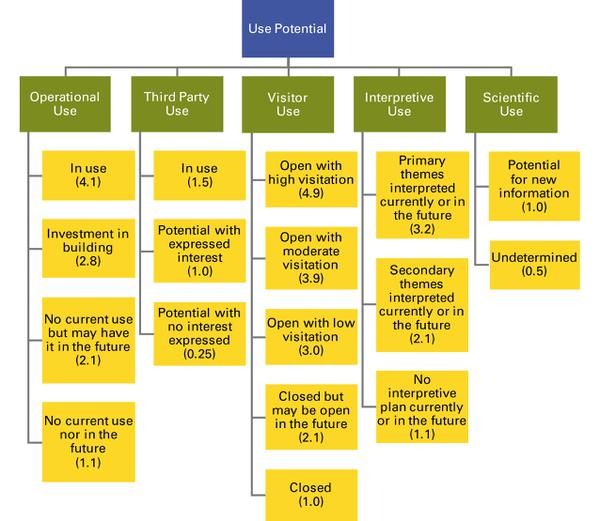
Figure 3. Diagram of use potential with its attributes (in green boxes) and associated metrics with mean scores (in yellow boxes).