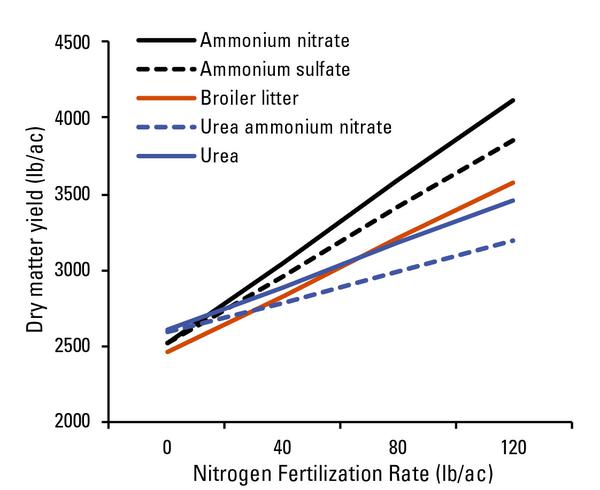
Figure 6. Stockpiled fescue responses to greater N fertilization rates and the extent of the response from differing fertilizer sources. Adapted from Teutsch et al. (2014).