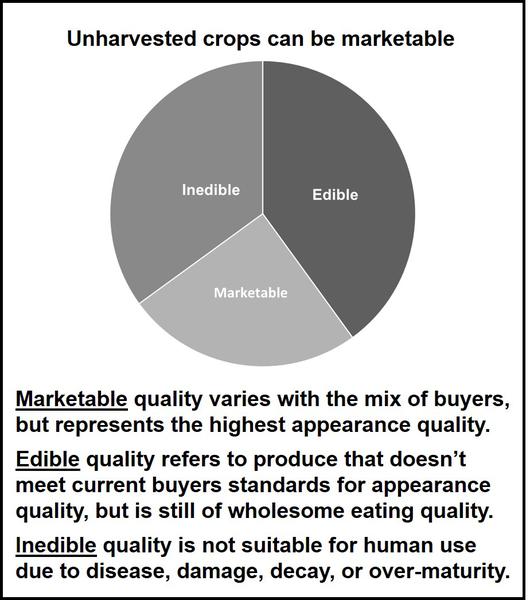
Figure 5. A mix of quality remains in the field.
Pie chart of marketable, edible and inedible crops