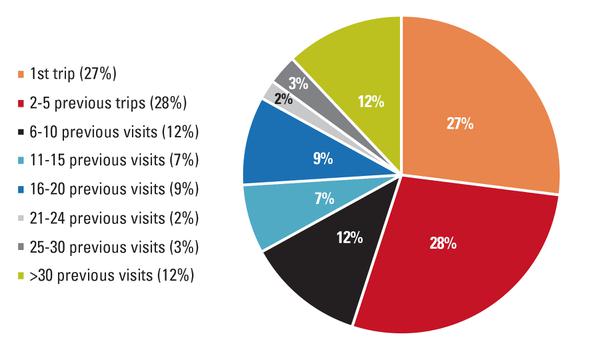
Figure 2. Visitation history to the OBX (% of respondents).
Pie chart showing percentages for different numbers of trips to OBX