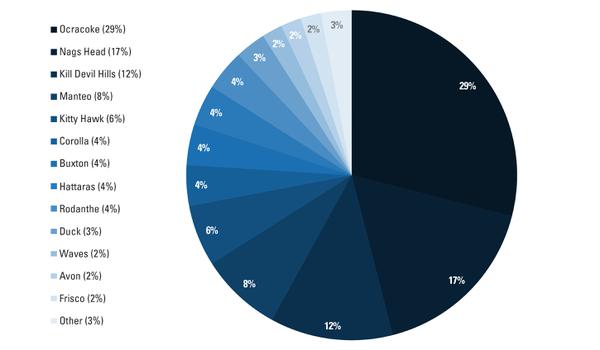
Figure 4. Closest town to primary destination (% of respondents).