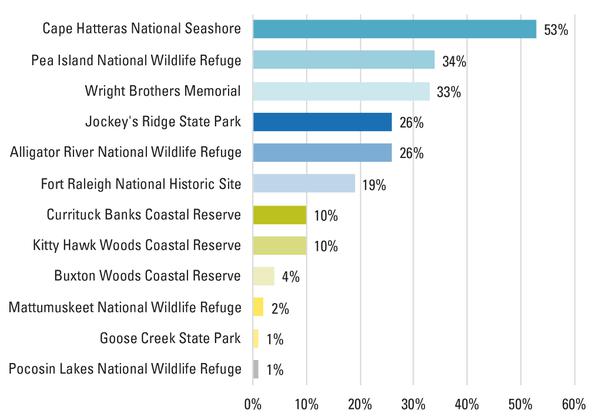
Figure 6. Planning to visit specific state or federal lands (% of respondents).