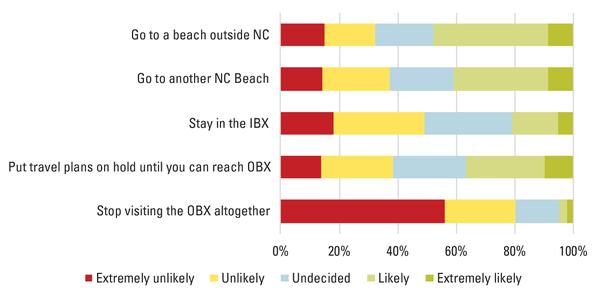
Figure 10. Likelihood of travel behaviors if the OBX could not be reached due to impacts from coastal hazards (% of respondents).