Many consumers are interested in purchasing goods and services that demonstrate increased environmental stewardship or promote awareness of sustainable practices. While there are a variety of labels, endorsements, and methods for companies to publicly exhibit “green” practices, one of the most powerful, but least understood, involves carbon accounting. Terms such as carbon footprint, carbon accounting, and life cycle assessment are commonly employed, but what do these terms mean and why are they used?
This publication focuses on some of the complexity related to global climate change and provides information on the process of carbon accounting. A related publication, AG-795 Life Cycle Assessment: Description and Methodology, describes a process for carbon accounting in greater detail with a simplified example.
Carbon Accounting Background
Carbon is one of the most abundant elements on Earth, the building block of cellular organisms, and vast quantities are stored in vegetation. Carbon is often tracked, because of its persistence in our atmosphere, with concerns over the quantity of carbon dioxide (CO2) and other chemicals that are emitted from anthropogenic (i.e., human induced) sources. Scientific evidence suggests these emissions increase the insulative effect of the atmosphere, causing the planet to retain heat from the sun (termed the greenhouse gas effect) (EPA, 2013a). This category of emissions is often referred to as greenhouse gases (GHGs). Products and activities that limit or store (sequester) GHGs from the atmosphere are considered to be environmentally beneficial by many.
The primary source of anthropogenic carbon dioxide is combustion and use of fossil fuels (IPCC, 2007). Another significant source involves human development, encapsulated by unsustainable practices such as urban sprawl (Gonzalez, 2005) and deforestation (IPCC, 2007). Urban sprawl and deforestation release carbon stored in plant tissue and soil into the atmosphere while removing land from uses that support carbon storage.
This publication reviews GHGs and the concept of global climate change. Additionally, it discusses methods that may be used to determine carbon balances or evaluate emission reduction strategies. The contents are intended to provide the public with greater understanding of terminology and methodologies employed in the carbon accounting process.
Motivation for Carbon Accounting: Global Climate Change
Use of the terms global warming or global climate change has become common in environmental conversations; however, distinctions in the terminology may not be clear. Global warming is theorized to be a result of greater GHG concentrations in the atmosphere, with carbon dioxide being the primary contributor (IPCC, 2007). Although global warming is commonly used, the more accurate term for the effects of escalated GHG concentrations is global climate change. Global warming implies an increase of Earth’s mean temperature, which has been observed by global average surface temperature over the past 150 years (IPCC, 2007). Global climate change implies modifications to climatic activities, which may include increased surface temperatures. This phenomenon may present itself as prolonged droughts, increased storm severity, and harsher winter conditions in many areas. Some models show that specific areas may actually cool as a result of global climate change (Goldstein et al., 2009). The use of the word climate implies long term modifications over an extensive area, not annual (or seasonal) fluctuations at a discrete location as commonly associated with temperature.
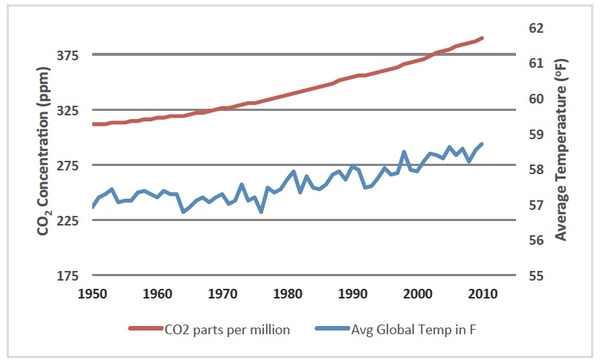
Commentary that is often heard in relation to this phenomenon includes, “it’s going to get hotter,” and “that isn’t good” (for humankind or the earth). At the forefront for many are memories of Al Gore’s An Inconvenient Truth (Gore, 2006) or the controversy surrounding emails leaked from the Climatic Research Unit (CRU) at the University of East Anglia (termed “Climategate” by some media sources). Emails leaked from the CRU were used by critics as evidence of a scientific conspiracy surrounding climate change. These emails primarily involved personal communications between researchers concerning a discrepancy in tree ring data and proxy temperatures. After extensive independent investigation, no evidence of fraud or scientific misconduct was found (Oxburgh et al., 2010; Muir et al., 2010). Though numerous computer models have been developed to investigate long-term implications of this phenomenon, there are some basic scientific principles that govern global climate change, including heat retention and cosmic cycles. Figure 1 exhibits a straightforward relationship between CO2 concentration, as measured at Mauna Loa Hawaii, and average global surface air temperature, as determined by NASA using the method described by Hasen and Lebedeff (1987).
Carbon dioxide acts as an insulator in Earth’s atmosphere, preventing solar radiation from dissipating into space (EPA 2013a). Other GHGs are also insulators and are assigned values—known as equivalence values—based on CO2 as a reference, which can persist in the atmosphere for nearly a century (EPA, 2013b). The equivalence value is used to demonstrate the relative strength of certain emissions at insulating the earth’s atmosphere compared to CO2. GHGs such as methane (CH4) and nitrous oxide (N2O) exhibit CO2 equivalents of 25 and 298 respectively (on a 100-year time horizon) (IPCC, 2007). In the above example, N2O is 298 times more powerful at retaining heat in the atmosphere than CO2. The 100-year horizon corresponds to the insulative power of the chemical in the given time frame; horizons are typically presented as 20, 100, and 500 years (Table 1). A shorter time horizon means that less persistent compounds are weighted more heavily but are commonly still compared to CO2 as a reference. These equivalents are used in carbon accounting to normalize emissions to CO2 equivalents, which can be summed for comparison.
Like other insulators, a direct linear correlation does not exist between increasing the quantity of insulation and the degree of heat retention (IPCC, 2007). This correlation is similar to home insulation where the initial layer has the greatest impact while successive layers have less effect on heat retention in the home. These insulating compounds are required to sustain life on Earth, but increased heat energy retention can have dire ramifications on various natural systems. It is important to note that water vapor is also a GHG, the most abundant in the atmosphere, but due to its relatively short atmospheric retention time it is commonly excluded from carbon balances. Excessive water vapor in the atmosphere can cause increased temperatures, which can lead to increased evaporation resulting in higher temperatures (NCDC, 2013).
| Common Name | Chemical Formula | Global Warming Potential | ||
| 20 yr. | 100 yr. | 500 yr. | ||
| Carbon Dioxide | CO2 | 1 | 1 | 1 |
| Methane | CH4 | 72 | 25 | 7.6 |
| Nitrous Oxide | N20 | 289 | 298 | 153 |
| Hydrofluorocarbons | CHFx- | 437-12,000 | 124-14,800 | 38-12,200 |
| Perfluorinated Compounds | -Fx | 5,210-16,300 | 7,390-22,800 | 9,500-32,600 |
| Fluorinated Ethers | 207-13,800 | 59-14,900 | 18-8,490 | |
Cosmic cycles can contribute to global climate change independent of human development or activity. These cycles include variations in Earth’s orbit around the sun and changes in the earth’s tilt. Cyclic cosmic effects occur on extremely long time frames and include rotational axis wobble (21,000 years), rotational axis tilt (42,000 years), and orbital shape (100,000 years) (MO DNR, 2013). A realistic, observable short-term cosmic effect may be the impact of sunspots, which can increase solar intensity.
The general consensus of the scientific community is that global climate change is occurring, and it is human induced (IPCC, 2007). Regardless of causation, some variations in climates are being observed globally, resulting in increased severity of storms (Aumann et al., 2008), droughts (Rind et al., 1990), floods (Andersen & Shepherd, 2013), and fluctuations in flora and fauna (IPCC, 2007). There has been a shift from mitigation to adaptation in some climatic research areas since, regardless of mitigation strategies, we may have to cope with modified climatic conditions to some degree. The insurance industry is making major attempts to manage the risks related to climate change by repackaging insurance products in response to increasing severe weather events (Mills, 2012). An ongoing study by Lawrence Berkeley National Laboratory reveals how warming temperatures, increased wildfires, sea level rise, and storm surges can negatively affect the electricity infrastructure in California, requiring major adaptation strategies (Sathaye et al., 2012). A side effect of increased CO2 concentrations is ocean acidification, which reduces the availability of minerals (specifically aragonite) required by corals, some plankton, and other sea creatures to form calcium carbonate exoskeletons (EPA, 2013c). This shift in marine ecosystems can have disastrous effects on already depleted commercial fisheries, further straining seafood markets.
Many implications of global climate change can have far reaching effects with unavoidable feedback loops, exemplified by the loss of permafrost in northern latitudes. As some of these soils thaw for the first time in centuries, gases are released— most notably CO2 and CH4— and dark soils are exposed, further increasing atmospheric concentrations of GHGs and intensifying solar absorption, in turn leading to further thawing (Koven et al., 2011). A similar trend is observed with melting sea ice, which increases solar absorption and sea temperature (Screen & Simmonds, 2010). Inclusion of fresh water from melting sea ice can decrease ocean salinity, potentially altering ocean currents, which can have global climatic implications (Williams et al., 2010). There are, however, some short-term benefits associated with these consequences, such as increased area for oil and gas exploration and opening of northern shipping routes.
Individuals skeptical of the human impact of climate change have argued that increases in atmospheric CO2 will be negated by accelerated plant growth. Most notably, in 2009, Representative John Skimkus (R-IL) made comments during the House Subcommittee on Energy and Environment regarding this sentiment. These claims have stemmed from legitimate scientific research, such as Donohue et al. (2013), that focused on specific regions and current atmospheric levels of CO2. While Norby et al. (2010) concluded that there are initial increases in plant growth from enhanced atmospheric CO2 levels, soil nitrogen is ultimately the major limiting factor to plant growth in many terrestrial ecosystems. Skeptics have also proposed that increased urbanization is having the primary effect on increased solar absorption. In other words, pavement for roads and parking lots, buildings, sidewalks, and other infrastructure create urban heat sinks that allow more retention of the sun’s energy, resulting in observed increases in global surface air temperatures.
While skeptics continue to debate human influence on climate change and the role of GHGs, many proposed reduction strategies, such as energy conservation and fossil fuel displacement, can be beneficial economically, socially, and environmentally regardless. Energy conservation is a major issue in residential, industrial, and commercial capacities and is one of the most meaningful strategies for GHG emission reductions. Regardless of the accuracy of fossil fuel reserve projections, such as those given in CRS (2009), fossil fuels are not sustainable, long-term energy solutions, so further incorporation and development of alternative energy sources is crucial. Shifting from a petroleum based economy to one that is biomass based has implications for energy production, rural development, and energy independence. Some fossil fuel reduction strategies may result in increased energy costs and reductions in some creature comforts (e.g., higher thermostat settings in the summer) in the short term. There is a considerable amount of research, development, and industrialization required to ensure safe and economic conditions when implementing novel technologies and reduction strategies. It’s important for skeptics to ask two important questions: “Is disregarding the human influence of climate change worth the risk?” and “How problematic are the reduction strategies?”
Carbon Credit Markets
Trading carbon credits is a market-based approach where groups claim reductions in carbon and GHG emissions by purchasing reduced emissions from another entity. The market for carbon credits can be split into two categories: compliance and voluntary (Westerman et al., 2008). Compliance is a response to legislation, such as a cap and trade system or the international carbon trading capacity of the Kyoto Protocol (UN 1998). This category requires select groups to participate in measures to reduce total carbon output or purchase credits to meet set standards. A voluntary carbon trading market allows carbon credits to be freely traded to meet noncompulsory standards. Usually companies will participate in carbon markets to improve their “green” image or demonstrate a desire to improve environmental stewardship. The first major voluntary cap and trade system in the U.S. came to an end with the closing of the Chicago Climate Exchange in 2010. Carbon trading still exists on the New York Mercantile Exchange with products from the European Union and California (CME, 2013). Some smaller niche markets exist in which private companies or outside organizations offer carbon offsets to purchase for things like energy, transportation, and other activities. These carbon offsets are meant to fill in the gaps where process improvement and reduction strategies fall short, but they can be used in lieu of reduction strategies. Generally funds from these offsets are used for GHG reduction projects such as landfill gas capture, renewable energy generation, or ecosystem conservation.
Although there are numerous companies that provide this service for varying prices and projects, it is important to ensure offset credits coincide with specified reduction goals. Green-e Climate (GC, 2014) is a group that certifies environmental commodities to ensure that offset credits are properly applied. Some states provide oversight of carbon credit markets, such as California’s Air Resource Board (CARB, 2014); however, some voluntary markets contain minimal oversight, and participation in carbon exchanges should be approached with due diligence.
Carbon Reduction Strategies
There are three primary categories of GHG emission reduction strategies: sequestration, displacement, and mitigation.
Sequestration refers to storing carbon in stable forms either below ground or in biomass material for extended periods.
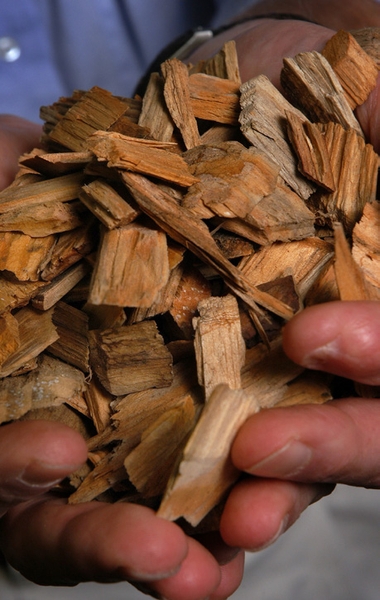
Below-ground sequestration can be a costly endeavor in which emissions from a power plant, or other industrial operation, are pumped underground. Subsurface carbon accumulation is also accomplished through root system production by establishing perennial crops (Figure 2), resulting in negative emission values for some of these systems (Clarens et al., 2010). Programs aimed at reforestation and restoration of grasslands also fall into this category when they are left for use as an above-ground carbon sink. Wood and biomass production is considered a short-term sequestration technique, though use of sustainable production practices makes continual storage possible (Profft et al., 2009).
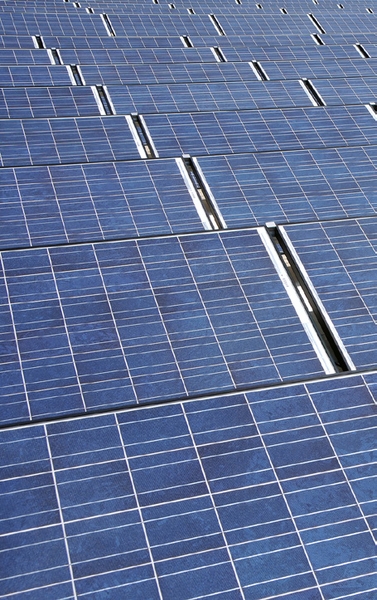
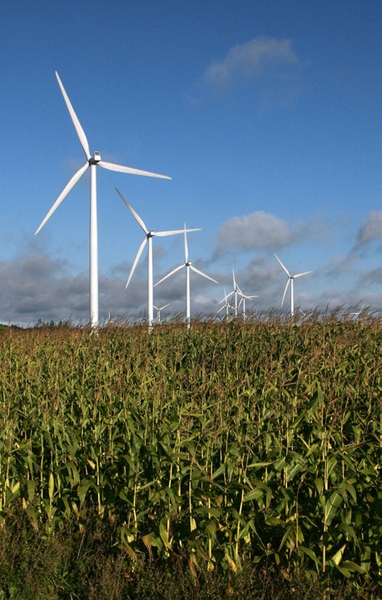
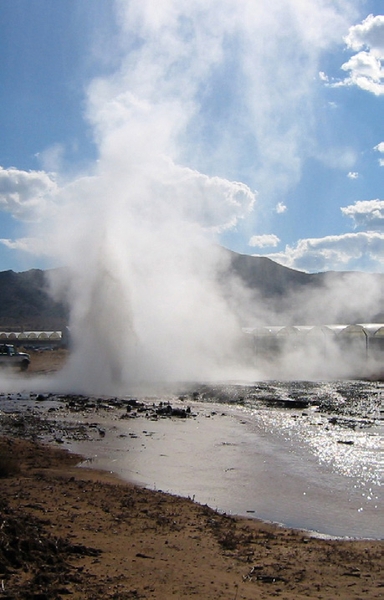
Displacement is the use of alternative energy sources that displace high carbon production types, such as fossil fuel combustion. This is accomplished through the use of multiple renewable energy sources, including wind, solar, hydropower, geothermal, and biomass. To a lesser extent, this is accomplished through the use of lower-emitting fossil fuels, such as natural gas in place of coal.
Mitigation strategies assess various sources of emissions throughout a system and determine reduction measures (i.e., energy efficiency improvements). Unlike the other categories, which either store or displace GHG emissions, mitigation focuses on reducing direct and indirect emissions. This may be represented in process improvements, energy efficiency, or emission reductions. Many strategies incorporate components of multiple categories, such as conservation tillage, which increases soil carbon stores (sequestration) and reduces direct emissions (mitigation), or use of landfill gas, which reduces methane emissions (mitigation) and can replace natural gas as a heating source (displacement).
U.S. federal agencies were tasked with reducing GHG emissions under Executive Order 13514 (inventories and reduction strategy) (EO13514, 2009), Executive Order 13423 (energy efficiency initiatives) (EO 13423, 2007), and the Energy Independence and Security Act of 2007 (low GHG emitting vehicles) (EISA ,2007). Some states have implemented similar GHG emission reduction strategies by either legislative action or executive orders. Under section 111 of the Clean Air Act (CAA, 1970), EPA is also granted the authority to regulate GHG emissions, which has been exercised on new power plant construction projects. According to a Presidential memorandum, GHG emission standards will also be developed for existing power plants (White House, 2013).
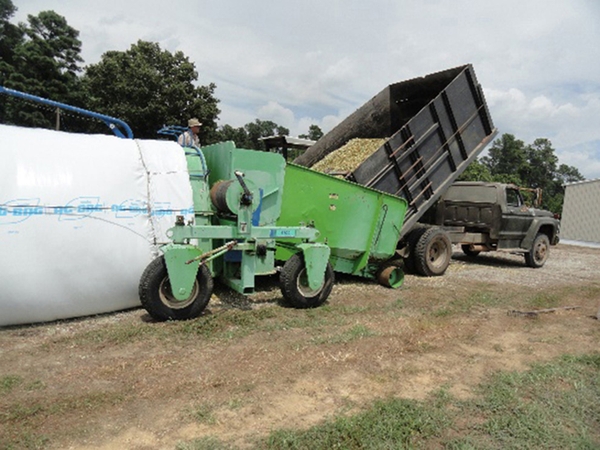
It is common to refer to direct CO2 emissions from biomass energy sources as biogenic, assigning a value of zero to these emissions. This does not, however, mean that there are no CO2 emissions from the combustion of energy sources derived from biomass. Biogenic assumes the growth of the next crop of biomass material will sequester approximately the same amount of CO2 from the current crop’s combustion. Biogenic also only accounts for direct CO2 emissions and not those related to indirect sources, including chemical application, harvest, transport, machinery, and storage (Figure 3). There is also a degree of carbon sequestration from the below ground root structures (generally left behind during harvest) that is not always accounted for. Biogenic emissions require either sustainable management practices, where the quantity of biomass grown annually is equivalent to the amount harvested, or a multi-year harvest plan common to the forestry industry.
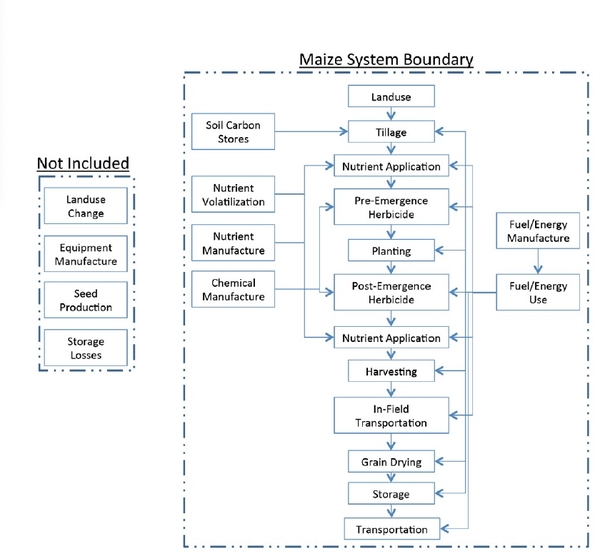
Marland (2010) argues that without a properly defined system boundary (an example of a system boundary is shown in Figure 4), bioenergy sources may not be carbon neutral. Spatial and temporal variations exist in emission production and sequestration, and they depend on crop production, storage, and system boundary. In other words, carbon emissions and storage never occur at the same time, in the same place. A controversial study by Manomet (2010) argues that there is a considerable time lag before carbon stocks for woody material reach the GHG emission levels of fossil fuel combustion, and such stocks are therefore not effective as an adequate carbon reduction strategy over the next one hundred years. Various studies have been published discrediting the Manomet study methodology (Lucier, 2010; O’Laughlin, 2010), arguing that use of a short-term plot level view of carbon emissions is not a proper method for long-term carbon management.
Carbon Accounting Methodology
Depending on carbon market or reduction strategy, the carbon accounting methodology may differ slightly in scope. A critical aspect of this type of analysis is setting the boundary for processes that will be considered in calculations and those that are far enough removed from the activity to be disregarded (Figure 4). A boundary can be as simple as inputs and outputs for direct emissions of major GHGs (carbon dioxide, methane, nitrous oxide, hydrofluorocarbons, perfluoinated compounds, and fluorinated ethers), can include upstream emission sources (e.g., mining operations of coal or harvesting of timber), or could assess material usage (e.g., packaging and equipment choices). The boundary needs to be set in accordance with the specific system goals in mind. For example, the maize system boundary shown in Figure 4 includes farm operations, nutrient volatilization, and manufacture of inputs but excludes land use change and equipment manufacturing, both of which are assumed to be outside the scope of the analysis.
After a boundary is set, an emission inventory is produced to determine sources of carbon emissions from the system. Following compilation of the emission inventory, standardization values are utilized to set all GHG emissions to CO2 equivalents; commonly, the IPCC values are used (IPCC 2007). There are also time horizons to consider (e.g., 20, 100, and 500 years)—which affect the insulative strength of the emissions—compared to CO2, taking into account their relative residence time in the atmosphere. A lower time horizon means that chemicals with a short residence time will be weighted more heavily. Choosing a proper time horizon may depend on the specific system being evaluated and the goals of the analysis.
In some cases this is the end of the analysis, yet these values can also be used to compare different reduction strategies and overall carbon impact. For example, one may consider which of the following is a better reduction strategy: construction of a woody biomass boiler or efficiency improvements of an existing natural gas unit? Carbon accounting is commonly accompanied by an economic comparison to decide if the additional costs are worth the overall reductions. Some modifications under consideration may show positive economic returns after an appropriate payback period, though this needs to be compared with the goals and scope of the reduction strategy. If emission reductions are required by legislative authority, the economic analysis may present the need for adjustments in consumer prices to recover emission reduction strategy costs.
Executive order 13514 (EO 13514), which tasks U.S. federal agencies to decrease GHG emissions, divides sources into three scopes for reduction strategies by expanding system boundary. The first scope represents direct emissions from owned or controlled property (e.g., vehicles and fugitive emissions) (EPA, 2013c). Scope two focuses on indirect emissions from utility sources purchased off-site (e.g., electricity, steam, and heating) (EPA, 2013c). The final scope, scope three, relates to indirect emissions from sources not owned or controlled, which currently includes transmission and distribution losses of electricity, travel, waste disposal, and wastewater treatment, but can be further expanded on a voluntary basis (EPA, 2013c). These scopes represent increased system complexity that may not be required for some analyses. For example, if modifications don’t affect electricity use, inclusion may not be required in the analysis. A more detailed approach for carbon accounting is available from IPCC (2006) with a series of reports outlining how to calculate emissions from different sectors.
Specific rules for carbon accounting may be set by the particular regulation, certification process, or carbon market being targeted. The U.S. rule for federal agencies is relatively simple with increasing complexity with expanding scope (1 to 3). It is important to review carbon reduction goals and set a system boundary to accurately account for GHG emissions. When comparing different reduction strategies, ensure that the specific characteristics of interest within the system fit the boundary. For example, if you are looking at packaging options, production and disposal methods are important to include in the system evaluation.
There are a number of methodologies for carbon accounting, including the life cycle assessment methodology (ISO, 2006a; ISO, 2006b), the greenhouse protocol from the World Resources Institute (WRI, 2013), and the Intergovernmental Panel for Climate Change (IPCC, 2006). A detailed description of life cycle assessment is outlined in AG-795 Life Cycle Assessment: Description and Methodology.
Conclusion
Use of carbon accounting has become a common method for government, private industry, and commercial enterprises to showcase their environmental stewardship. Accounting for GHG emissions can be a daunting task, but this process can be focused by ensuring the system boundary properly aligns with project goals and scope. A basic understanding of carbon accounting can assist the public with making informed decisions related to “green” products.
Acknowledgements
The authors would like to acknowledge former North Carolina Extension Specialist Dr. Matthew W. Veal, Ph.D. for his innovation and leadership in development of this publication.
References and Resources
Other sources are available with more detailed explanations, including Carbon Credits: for Methane Collection and Combustion (Westerman et al. 2008) for carbon market information and the U.S. Environmental Protection Agency website (EPA 2013d) for process methodology.
The following resources were used in the publication of this article. They will provide more information on these topics and would be useful if a carbon accounting methodology needs to be developed.
Andersen, T.K., and J.M. Shepherd. Floods in a Changing Climate. Geography Compass 7(2): 95-115.
Aumann, H.H., A. Ruzmaikin, and J. Teixeira. 2008. Frequency of severe storms and global warming. Geophysical Research Letters 35(19).
CAA. 1970. Clean Air Act of 1970. 42 U.S.C 7401. United States of America: Washington, DC.
CARB. 2014. California Environmental Protection Agency Air Resources Board. Accessed: August 5, 2014.
Clarens, A., E. Resurreccion, M. White, and L. Colosi. 2010. Environmental Life Cycle Comparison of Algae to Other Bioenergy Feedstocks. Environ. Sci. Technol. 44: 1813-1819.
CME. 2013. CME Group NYMEX Carbon Products. CME Group: Chicago, IL. Retrieved August 10, 2013.
CRS. 2009. U.S. Fossil Fuel Resources: Terminology, Reporting, and Summary. US Congressional Research Service. Authors: G. Whitney, C.E. Behrens, and C. Glover. 7-5700 (R40872).
Donohue, R.J., M.L. Roderick, T.R. McVicar, and G.D. Farquhar. 2013. Impact of CO2 fertilization on maximum foliage cover across the globe’s warm, arid environments. Geophysical Research Letters 40: 3031-3035.
EISA. 2007. Energy Independence and Security Act of 2007. 42 U.S.C. 7545. United States of America: One Hundred Tenth Congress of the United States of America: Washington, DC.
EO 13423. 2007. Strengthening Federal Environmental, Energy, and Transportation Management. Federal Register Vol. 72 No. 17: Washington, DC.
EO 13514. 2009. Federal Leadership in Environmental, Energy, and Economic Performance. Federal Register Vol. 74. No. 194: Washington, DC.
EPA 2013a. The Greenhouse Effect. A student’s guide to global climate change. U.S. Environmental Protection Agency: Washington, DC. Retrieved November 9, 2013.
EPA. 2013b. Overview of Greenhouse Gases. U.S. Environmental Protection Agency: Washington, DC. Retrieved August 10, 2013.
EPA. 2013c. Climate Change Indicators in the United States. U.S. Environmental Protection Agency: Washington, DC. Retrieved August 10, 2013.
EPA. 2013d. EPA’s Greenhouse Gas Emission Reductions. U.S. Environmental Protection Agency: Washington, DC. Retrieved August 10, 2013.
GC. 2014. Green-e Climate. Accessed: August 4, 2014.
Goldstein, A.H., C.D. Koven, C.L. Heald, and I. Fung. 2009. Biogenic Carbon and Anthropogenic Pollutants Combine to Form a Cooling Haze over the Southeastern United States. Proceedings of the National Academy of Sciences 106(22): 8835-8840.
Gonzalez, G.A. 2005. Urban Sprawl, Global Warming and the Limits of Ecological Modernisation. Environmental Politics 14(3): 344-362.
Gore, A. 2006. An Inconvenient Truth: The Planetary Emergency of Global Warming and What We Can Do About It. New York: Rodale.
Hansen, J., and S. Lebedeff. (1987). Global Trends of Measured Surface Air Temperature. Journal of Geophysical Research 92(D11): 13345-13372.
IPCC. 2007. Climate Change 2007: Synthesis Report. Contribution of Working Groups I, II, and III to the Fourth Assessment Report of the Intergovernmental Panel on Climate Change. Core Writing Team: Pachauri, R.K., and Reisenger, A. IPCC: Geneva, Switzerland. Retrieved July 31, 2014.
IPCC. 2006. 2006 IPCC Guidelines for National Greenhouse Gas Inventories. Intergovernmental Panel on Climate Change: Geneva Switzerland. Retrieved August 20, 2013.
ISO. 2006a. Environmental management—Life cycle assessment—Principles and framework (ISO 14040: 2006 (E)). International Organization for Standardization: Geneva, Switzerland.
ISO. 2006b. Environmental management—Life cycle assessment—Requirements and guidelines (ISO 14044: 2006 (E)). International Organization for Standardization: Geneva, Switzerland.
Koven, C.D., B. Ringeval, P. Friedlingstein, P. Ciais, P. Cadule, D. Khvorostyanov, G. Krinner, and C. Tarnocai. 2011. Permafrost carbon-climate feedbacks accelerate global warming. Proceedings of the National Academy of Science USA 108(36): 14769-14774.
Lucier, A. 2010. A Fatal Flaw in Manomet’s Biomass Study. The Forestry Source, September 2010: 4.
Manomet Center for Conservation Sciences. 2010. Massachusetts Biomass Sustainability and Carbon Policy Study: Report to the Commonwealth of Massachusetts Department of Energy Resources. Walker, T. (Ed.). Contributors: Cardellichio, P., Colnes, A., Gunn, J., Kittler, B., Perschel, R., Recchia, C., Saah, D., and Walker, T. Natural Capital Initiative Report NCI-2010-03. Brunswick, Maine.
Marland, G. 2010. Accounting for Carbon Dioxide Emissions from Bioenergy Systems. Journal of Industrial Ecology 14(6): 866-869.
Mills, E. 2012. The Greening of Insurance. Science 338: 1424- 1425.
MO DNR. 2013. Global Climate Change: Effect of the Earth’s Orbit. Missouri Department of Natural Resources: Jefferson City, MO. Retrieved August 10, 2013.
Muir, R., G. Boulton, P. Clarke, D. Eyton, and J. Norton. 2010. The independent climate change e-mail review. Retrieved November 9, 2013.
NASA. 2013. Global Temperature Anomalies in 0.01 degrees Celsius. National Aeronautics and Space Administration. Retrieved November 9, 2013.
NCDC. 2013. Water Vapor. Greenhouse Gases. National Climatic Data Center: National Oceanic and Atmospheric Administration. Retrieved November 9, 2013.
NOAA. 2013. Trends in Atmospheric Carbon Dioxide. Full Mauna Loa CO2 record. National Oceanic and Atmospheric Administration. Retrieved: November 9, 2013.
Norby, R.J., J.M. Warren, C.M. Iverson, B.E. Medlyn, and R.E. McMurtrie. 2010. CO2 enhancement of forest productivity constrained by limited nitrogen availability. Proceedings of the National Academy of Sciences 107: 19368-19373.
O’Laughlin, J. 2010. Accounting for Greenhouse Gas Emissions from Wood Bioenergy: Response to the U.S. Environmental Protection Agency’s Call for Information, Including Partial Review of the Manomet Center for Conservation Sciences’ Biomass Sustainability and Carbon Policy Study. University of Idaho, College of Natural Resources, Policy Analysis Group, Report No. 31: Moscow, ID.
Oxburgh, R., H. Davies, K. Emanuel, L. Graumlich, D. Hand, H. Huppert, and M. Kelly. 2010. Report of the international panel set up by the University of East Anglia to examine the research of the Climatic Research Unit. Retrieved November 9, 2013.
Profft, I., M. Mund, G.E. Weber, E. Weller, and E.D. Schulze. 2009. Forest management and carbon sequestration in wood products. Eur. J. Forest Res. 128: 399-413.
Rind, D., R. Goldberg, H. Hansen, C. Rosenzweig, and R. Ruedy. 1990. Potential Evapotranspiration and the Likelihood of Future Drought. Journal of Geophysical Research 95 (D7): 9983-10,004.
Sathaye, J., L. Dale, P. Larsen, G. Fitts, K. Koy, S. Lewis, and A. Lucena. 2012. Estimating Risk to California Infrastructure From Projected Climate Change. California Energy Commission. Publication Number: CEC-500-2012-057.
Screen, J.A., and I. Simmonds. 2010. The central role of diminishing sea ice in recent Artic temperature amplification. Nature 464: 1334-1337.
Strullu L, Cadoux S, Preudhomme M, Jeuffroy MH, Beaudoin N 2011. Biomass Production and nitrogen accumulation and remobilisation by Miscanthus giganteus as influenced by nitrogen stocks in belowground organs. Field Crops Research, 121,381–391.
UN. 1998. Kyoto Protocol to the United Nations Framework Convention on Climate Change. UN Doc FCC/CP/1997/7/ Add.1, Dec. 10, 1997; 37 ILM 22 (1998).
Westerman, P., M. Veal, J. Cheng, and K. Zering. 2008. Carbon Credits: for Methane Collection and Combustion (AG-708). North Carolina Cooperative Extension: Raleigh, NC.
White House. 2013. Presidential Memorandum—Power Sector Carbon Pollution Standards. The White House Office of the Press Secretary: Washington, DC. Retrieved August 10, 2013.
Williams, P.D., E. Guilyardi, G. Madec, S. Gualdi, and E. Scoccimarro. 2010. The role of mean ocean salinity in climate. Dynamics of Atmospheres and Oceans 49(2-3): 108-123.
WRI. 2013. Greenhouse Gas Protocol. World Resource Institute. Retrieved November 11, 2013.
Publication date: Feb. 10, 2015
AG-793
N.C. Cooperative Extension prohibits discrimination and harassment regardless of age, color, disability, family and marital status, gender identity, national origin, political beliefs, race, religion, sex (including pregnancy), sexual orientation and veteran status.

