
Using α, α'- Dipyridyl as a Test for Iron Reduction
Preparation
The Natural Resources Conservation Service uses a 0.2% solution of α, α'-dipyridyl dye to test for iron reduction. To prepare it, dissolve 77 g of ammonium acetate (NH4OAc) in 1 liter of distilled water. Add 2 g of α, ά-dipyridyl powder and stir until dissolved. Store the solution in the dark.
Use
For field use, carry the solution in a small squirt bottle. Spray the solution onto a field-moist sample. A pink color will appear in a few minutes if ferrous iron is present. This indicates that the horizon from which the sample came is reduced for soil classification purposes.
Comments
False positive readings for ferrous iron can occur if the dye solution is applied to soil that (1) has been in contact with steel (for instance, augers, probes, or knives), (2) has been exposed to strong sunlight after the dye solution has been applied, or (3) has been treated with a 10% solution of hydrochloric acid to test for carbonates. More information on the use of this solution is presented in Childs (1981).
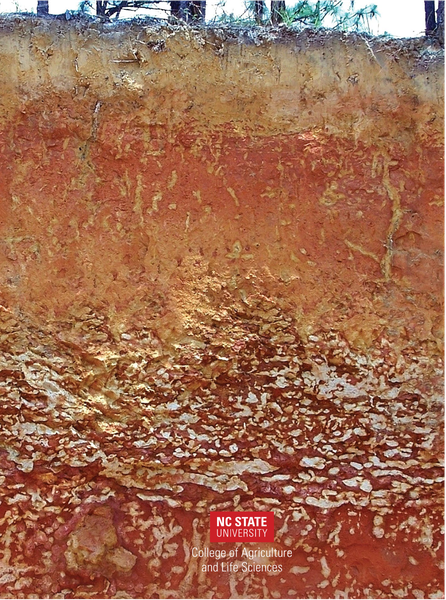
Cover: Vaucluse series. Redox depletions shown in subsoil, most likely around root channels.
Photo by John A. Kelley, USDA Natural Resources Conservation Service
To order, email CALS Communications at extension_publications@ncsu.edu. $5 per copy (US dollars only)
North Carolina Agricultural Research Service
College of Agriculture and Life Sciences
North Carolina State University
Raleigh, North Carolina
Technical Bulletin 301
Reviewed and Reprinted August 2015
Figures by Nickola Dudley

Redox depletion along prism surfaces of the Bt horizon of an Arenic Plinthic Paleudult near Conroe, Texas. This horizon is shown in cross-section.
Preface
The recommendations discussed in this bulletin were suggested by members of the International Committee on Soils with Aquic Soil Moisture Regimes (ICOMAQ). This group was organized by the USDA’s Soil Conservation Service (now Natural Resources Conservation Service) to make improvements to the existing soil classification system used by the National Cooperative Soil Survey (Soil Taxonomy). The committee was assembled in 1982 under the direction of Dr. Frank Moorman, and in 1985, the chairmanship was passed to Dr. Johan Bouma.
The redoximorphic features that will be discussed were identified by a working group of ICOMAQ whose members included M. J. Vepraskas (Chairman), J. Amatekpor, B. Brasher, Z. S. Chen, D. Creutzberg, R. Griffin, S. Holzey, M. D. Hussain, R. Langhor, M. Mitsuchi, J. Nichols, J. Nyenhuis, K. Samaranayake, S. Shoji, and A. Szogi. This bulletin was reviewed by S. W. Buol, R. B. Daniels, W. R. Guertal, G. W. Hurt, H. J. Kleiss, P. A. McDaniel, S. E. Monteith, E. M. Rutledge, F. C. Watts, D. Williams, and J. Witty. Their help is greatly appreciated.
Mike Vepraskas
Raleigh
Contents
Problems with the Aquic Moisture Regime
Types of Redoximorphic Features
Formation of Redoximorphic Features
Describing Redoximorphic Features
Interpreting Water Movement Using Redoximorphic Features
Introduction
The aquic moisture regime that has been used in Soil Taxonomy pertains to soils saturated with water and chemically reduced such that the soil water contains virtually no dissolved oxygen (Soil Survey Staff, 1975). At the suborder level of classification, soils that have an aquic moisture regime are saturated and reduced from the soil surface to a depth of 2 m. At the subgroup level, soils are classified as having an aquic moisture regime if only the lower soil horizons are saturated and reduced. At the series level, the aquic moisture regime is refined further to include the kind, depth, duration, and frequency of water tables.
While the aquic moisture regime was defined on the basis of saturation and reduction, measurements of these properties were not required to classify the soil. Instead, soil colors were used to determine if the soils are saturated and reduced at some time during the year. Generally, low (< 2) chroma or gray colors are used as indicators of saturation and reduction, but in some soils hues of 2.5Y or 5Y were used when iron mottles were present.
Field-testing has shown that the original definition of the aquic moisture regime was not precise enough to enable an unequivocal identification of it in the field. The International Committee on Soils with Aquic Soil Moisture Regimes (ICOMAQ) has been at work on improving the definition of an aquic moisture regime since 1978. Final recommendations from ICOMAQ were made in 1991 (Bouma, 1991). Those changes that were accepted for use by the National Cooperative Soil Survey took effect in 1992 (Soil Survey Staff, 1992). The term “aquic conditions” has been introduced to cover the requirements for saturation, reduction, and morphological indicators used to define the modified aquic moisture regime. Thus, soils that have an aquic moisture regime have aquic conditions. “Aquic conditions” or one of the various components is now used throughout the Keys to Soil Taxonomy (Soil Survey Staff, 1992) as a substitute for the aquic moisture regime, mottles with chromas of 2 or less, and characteristics associated with wetness.
The purpose of this bulletin is (1) to describe the requirements for aquic conditions, (2) to show how redoximorphic features needed to define aquic conditions can be identified and described, and (3) to discuss how redoximorphic features can be interpreted.
Problems with the Aquic Moisture Regime
Aquic conditions were defined to correct problems with the aquic moisture regime. Some of-the prominent concerns were as follows:
- Perched versus true groundwater tables. The aquic moisture regime did not clearly recognize perched saturated layers where upper horizons were saturated but lower horizons were not. This was due in part to a lack of unambiguous soil morphological criteria that could be used both to identify soils having perched saturated horizons and to define taxa for these soils (Moorman and van de Wetering, 1985).
- Saturation without reduction was not recognized. The aquic moisture regime stressed saturation with reduction. In some cases, however, saturation alone is the most important criterion, particularly with regard to on-site waste disposal and home construction. Soils that are saturated but not reduced do not develop low (< 2) chroma or gray colors (Couto et al., 1985; Daniels et al., 1973).
- Morphology alone was used to determine if soils were saturated and reduced. Mottles and low chroma colors in a soil horizon form by processes related to saturation and reduction, and usually indicate that these processes are actively occurring during the year or have occurred in the horizon at some time in the past. Soil mottling patterns can also be relicts of past moisture regimes, and relict colors have been identified in several studies (Bouma, 1983; Franzmeier et al., 1983; Ruhe et al., 1955). In addition, soils having high pH or lacking iron oxide minerals may not have mottles or low chroma colors, despite being saturated and reduced. Other problems related to using morphology to determine saturation and reduction were discussed by Moorman and vande Wetering (1985).
- Paddy soils were not recognized as a separate taxa. Paddy soils have been flooded under controlled conditions. In parts of Asia, paddy soils have been flooded for 1,000 years or more. The properties of such soils have changed, and the soils should be considered as separate taxonomic entities.
Aquic Conditions
To address these problems in revising the aquic moisture regime, more emphasis had to be given to documenting that saturation and reduction do occur in a soil. Thus, ICOMAQ recommended that the way the moisture regime is identified be changed.
Aquic conditions should be identified by determining three separate properties for every soil series: (1) depth of saturation, (2) occurrence of reduction, and (3) presence of redoximorphic features. Redoximorphic features include Fe nodules and mottles that form in the soil by the reduction, translocation, and oxidation of Fe or Mn oxides. The intent of requiring that these three properties be measured is to make certain at some locations that saturation and reduction do currently occur in a soil at some time during a year. The depth of interest for aquic conditions ranges from the soil surface down to 2 m.
Identifying the aquic moisture regime requires documenting that soils (1) are saturated, (2) are reduced, and (3) have redoximorphic features.
Once saturation, reduction, and redoximorphic features have been confirmed for a soil at one site, the saturation and reduction data can be extrapolated to other similar soils using the redoximorphic features alone. This approach calibrates the redoximorphic features of each soil to specific periods of saturation in particular and ensures that the features are not relicts. Relict redoximorphic features formed in an earlier period when the soil was saturated and reduced. Due to geological processes such as stream down-cutting or even large-scale land drainage, formerly wet soils can now be better drained and not saturated or reduced during most years. Such soils may still retain the old redoximorphic features that formed during wetter periods.
To avoid misinterpreting redoximorphic features, measurements of saturation and reduction must be made locally to show that these reduction processes still occur. Detailed measurements made over time also establish the duration that soils are saturated each year. It is now recognized that the relationships of redoximorphic features to the lengths of time the soils are saturated and reduced are too variable worldwide for us to specify, at this time, basic relationships that can be applied to all soils.
Redoximorphic features must be calibrated to specific periods of saturation and reduction.
Saturation
A horizon is considered saturated when the soil water pressure is zero or positive. At these pressures water will flow from the soil matrix into unlined auger holes. Use of an auger hole to confirm saturation may be inaccurate or misleading in clayey soils when only macropores are filled with water, because the macropores may have filled during a recent rain while the soil matrix remained unsaturated. Therefore, tightly sealed piezometers or tensiometers are recommended to confirm saturation. These instruments should be sealed with clay (e.g., bentonite) to prevent surface water from running down the sides of the instruments.
Three types or patterns of saturation were defined:
- Endosaturation occurs in soils periodically saturated in all horizons that lie between the upper boundary of saturation and a depth of 2 m.
- Episaturation occurs in soils having “perched” layers of saturation. The soil is periodically saturated in one or more horizons that overlie one or more unsaturated horizons within 2 m of the surface. If the bottom of the saturated horizons extends below a depth of 2 m, then endosaturation is present, even if unsaturated horizons occur below the saturated horizons.
- Anthric saturation is similar to episaturation except that saturation is produced by controlled flooding for wetland rice or cranberries.
It should be noted that the term “water table” is not used in the definition of saturation. The depth to the water table is difficult to define precisely when using piezometers or tensiometers, which measure soil water pressure.
Therefore, what is of interest is whether a specific horizon has soil water pressures that are zero or positive at some time during the year. Because the capillary fringe above a water table contains soil water that has pressures less than atmospheric pressure (the water is under a suction), horizons within the capillary fringe are technically not considered saturated for aquic conditions.
Under ideal circumstances, horizons that are saturated by the above criteria will have all their soil pores filled with water. However, for a horizon to be considered saturated for aquic conditions, it is not necessary that all pores be filled with water. Horizons that have water pressures of zero or positive are considered saturated even if they contain entrapped air in some pores. Conversely, some dense horizons that do not contain macropores may have all pores filled, water when the soil water is under a tension or suction (Vepraskas and Wilding, 1983b). Such horizons are technically not saturated for aquic conditions. Exceptions to this interpretation may be necessary, however, if the horizons are reduced.
Saturation can occur at any time during the year, not just during the growing season or when soil temperatures exceed 5°C. One reason for this is that in soils having permafrost, reduction occurs in soil overlying the permafrost even though its temperature is at or near 0°C (Ping et al., 1992). Saturation is not required for aquic conditions when soils are artificially drained. In general, this is because the soil will again become saturated should the drainage system fail.
Reduction
Reduction is now considered to require the reduction of Fe rather than simply the depletion of oxygen. Any method that indicates the presence of reduced Fe (Fe II) is considered suitable for assessing reduction. Reduction can be determined using platinum microelectrodes to measure oxidation-reduction potentials (redox potentials or Eh values). The critical redox potentials needed for Fe reduction are pH-dependent and should be determined from an Eh-pH diagram (Collins and Buol, 1970).
A neutral (pH 7) solution of α, α'-dipyridyl dye dissolved in 1 N ammonium acetate can also be used in the field to confirm that reduction is occurring (Childs, 1981). The colorless dye solution can be applied to freshly broken surfaces of field-wet soil samples, and Fe (II) is indicated when the dyed soil turns to a reddish color. No minimum time for reduction is required during a year. Reduction need only be confirmed once, using either the dye or electrodes. The best time to confirm that Fe reduction is occurring is when the soils are saturated.
False readings can occur with dye solutions. In one case, reduced Fe (II) may be present without being recognized; in the other case, Fe (II) may not be present initially but may be produced by using the dye solution in intense sunlight (Childs, 1981). The dye is sensitive to light. A fresh solution should be replaced periodically, because “old” solutions may be incapable of reacting to Fe (II). On the other hand, soils such as Spodosols may have the oxidized form of iron, Fe (III), present in horizons that contain oxidizable organic compounds. When the dye solution is placed on a sample containing these substances and the sample is then exposed to intense sunlight, the Fe (III) can be reduced to Fe (II) by the sunlight. The Fe (II) will then react with the dye to produce a red color on the sample, giving a false indicator of reduction. Such a misleading reading might be avoided by keeping the sample in the dark for a while after the dye is applied, and then quickly examining the sample without exposing it to direct sunlight.
The α, α'-dipyridyl dye is not dangerous to use but is toxic if ingested. According to the “Material Safety Data Sheet” supplied by chemical manufacturers for the year 2014, α, α'-dipyridyl may irritate skin and especially eyes. It has not been found to cause cancer. When using α, α'- dipyridyl dye the same precautions should be taken as with insect repellent (i.e., do not drink it or get it in the eyes) and a 10% solution of HCl (i.e., minimize skin contact).
Information about health hazards associated with this dye can be obtained from the Sigma-Aldrich Corporation, 1001 West Saint Paul Ave., Milwaukee, WI 53233 (telephone no. 1-800-231-8327). The dye is known by at least seven different names (e.g., 2, 2’-dipyridyl, 2, 2’- bipyridyl). It can also be identified by CAS No. 366-18-7.
Redoximorphic Features
Mottles and low chroma colors were replaced in Soil Taxonomy by redoximorphic features. These features are formed by the processes of reduction, translocation, and oxidation of Fe and Mn oxides. “Mottles” technically include carbonate accumulations and organic stains that do not indicate saturation and reduction. Redoximorphic features, on the other hand, are those formed by the reduction and oxidation of Fe and Mn compounds in seasonally saturated soils.
Redoximorphic features were defined for the most part using micromorphological concepts (Bullock et al., 1985). Because these features may be seen with the naked eye or with a hand lens, they can be described by soil mappers in the field. It was assumed that thin sections would not be used to identify or describe redoximorphic features routinely, and that microscopic examination of features was also not practical on a routine basis.
Some new terms were invented to name redoximorphic features. The terms had to conform to existing terms in the Soil Survey Manual. They also had to be simple and descriptive so that they could be easily remembered.
Types of Redoximorphic Features
The following kinds of redoximorphic features have been identified for use in profile descriptions. Examples are shown schematically in Figure 1 and Figure 2a, Figure 2b, and Figure 2c.
- Redox concentrations. Bodies of apparent accumulation of Fe-Mn oxides (Figure 1).
- Nodules and concretions (Figure 3). Firm to extremely firm irregularly shaped bodies. When broken in half, concretions have concentric layers, whereas nodules have a uniform internal fabric. However, the terms “nodules” and “concretions” frequently have been used interchangeably.
- Masses (Figure 4). Soft bodies, frequently within the matrix, whose shape is variable. Masses include features that formerly would have been called “reddish mottles.”
- Pore linings (Figure 5). Zones of accumulation that may be either coatings on a pore surface or impregnations of the matrix adjacent to the pore.
- Redox depletions. Bodies of low chroma (< 2) having values of 4 or more where Fe-Mn oxides alone have been stripped out or where both Fe-Mn oxides and clay have been stripped out (Figure 2b and Figure 2c).
- Iron depletions (Figure 6a and Figure 6b). Low chroma bodies with clay contents similar to that of the adjacent matrix. These features have sometimes been called “gray mottles,” “gley mottles,” “albans” or “neoalbans.” They may occur along macropores and also within the matrix. When the soil matrix has a color chroma of < 2, it can be considered an iron depleted matrix.
- Clay depletions (Figure 6c). Low chroma bodies containing less Fe, Mn, and clay than an adjacent soil matrix. They have been described as “silt coatings” or “skeletans” formed along ped surfaces or lining channels. The clay eluviated from the clay depletions frequently is found coating ped surfaces in underlying horizons.
Iron depletions can occur along pores and in the matrix.
Clay depletions form in place. They do not form by deposition of silt onto pore surfaces.
- Reduced matrices (Figure 7). Soil matrices that have a low chroma color in situ because of the presence of Fe (II), but whose color changes in hue or chroma when exposed to air as the Fe (II) is oxidized to Fe (III). The change in color occurs within 30 minutes or less after the sample is exposed to air. This period is variable and may have to be determined by local field studies.
- Exceptions. There are at least two cases when the features listed above cannot reliably be considered as redoximorphic features reflecting current aquic conditions.
- Low chroma matrix colors that do not indicate saturation and reduction. Several examples of these are known. Colors having a color value moist of 3 or less and found in horizons with organic matter accumulations cannot be used as redoximorphic features. Low chroma organic stains and low chroma carbonate accumulations are not considered to be redoximorphic features. Exceptions to the value limit do occur. Higher values may have to be excluded under some situations where measurements show saturation does not occur.
In addition, low chroma colors may occur in some parent materials that originally contained little or no iron. Iron also can be stripped from soil particles by organic compounds such as chelates, and these reactions may not require saturated conditions. Low chroma colors not formed by saturation and reduction tend to be found more often in sandy soils than in finer-textured soils (Hyde and Ford, 1989). Accordingly, it is critical that saturation and reduction be confirmed by measurements before assuming that low chroma colors found in a soil indicate that the soil is seasonally saturated and reduced.
- Nodules and concretions composed of Fe and Mn oxides are resistant features and may be relicts of wetter conditions many years before the present, or may have formed at other locations and were transported to the present site. Nodules and concretions with sharp boundaries usually did not form in the horizon they are observed in, particularly if they occur in clay depletions. For this reason, nodules and concretions should not be used as redoximorphic features when they are the only features present, unless it is known from measurements of water saturation that they represent current conditions
- Low chroma matrix colors that do not indicate saturation and reduction. Several examples of these are known. Colors having a color value moist of 3 or less and found in horizons with organic matter accumulations cannot be used as redoximorphic features. Low chroma organic stains and low chroma carbonate accumulations are not considered to be redoximorphic features. Exceptions to the value limit do occur. Higher values may have to be excluded under some situations where measurements show saturation does not occur.
Redox Depletions
Figure 1. Schematic illustration showing different kinds of redox concentrations and their relationship to soil macropores and matrices.
Figure 2a, Figure 2b, Figure 2c. Schematic illustrations of redox depletions showing changes in color and texture as ped surfaces develop Fe depletions and clay depletions.
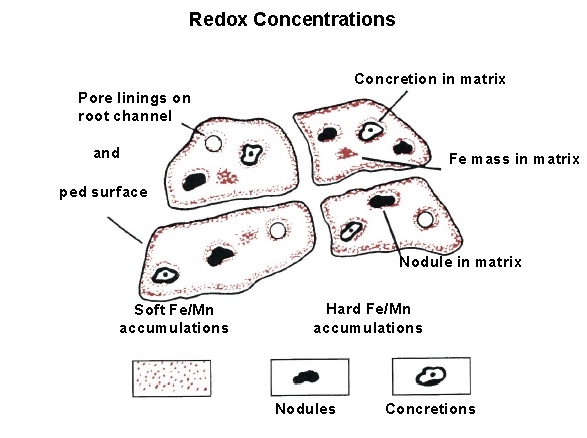
Figure 1. Schematic illustration showing different kinds of redox concentrations and their relationship to soil macropores and matrices.
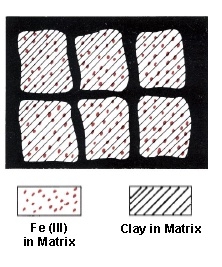
Figure 2a. No redox depletions. Peds have a 10YR 6/6 color throughout.
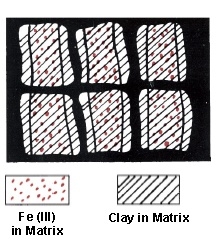
Figure 2b. Fe depletions along ped surfaces. Peds have a 10YR 6/2 color; ped matrices have 10YR 6/6 color.
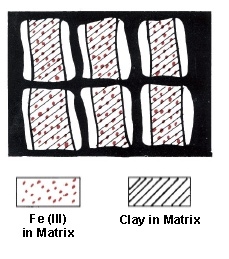
Figure 2c. Clay depletions along ped surfaces have a 10YR 6/1 color, ped matrices a 10YR 6/6 color. Underlying horizons have gray clay coatings on ped surfaces.
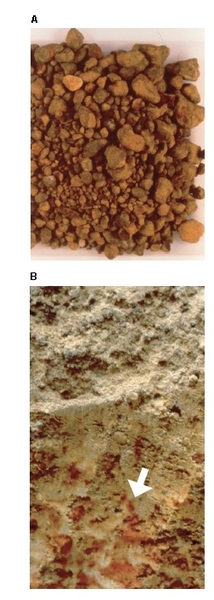
Figure 3. Examples of Fe/Mn nodules that have been washed (A) and as they appear in a pit wall (B). In (A) largest nodules are 20 mm in diameter. In (B) arrow shows a nodule also 20 mm in diameter.
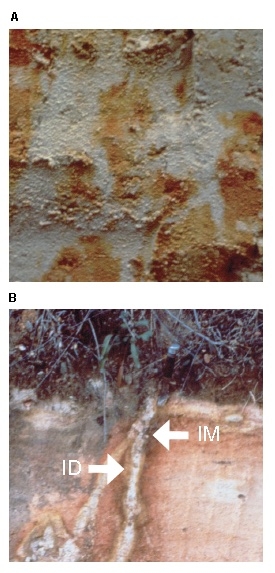
Figure 4. Examples of Fe masses. Masses in (A) occur in the soil matrix and are up to 30 mm in diameter. The gray colors are Fe depletions. In (B), an Fe mass (IM) lies in the matrix, parallel to a root channel that has an Fe depletion (ID) along it. The Fe depletion is approximately 30 mm wide.
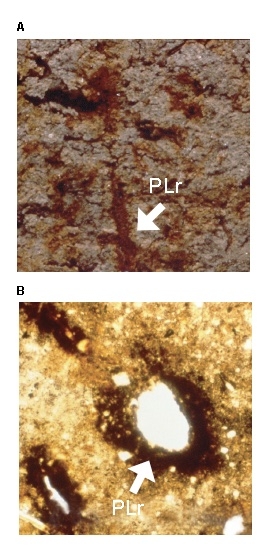
Figure 5. Examples of pore linings. Pore linings in (A) primarily are along root channels (PLr) (photograph supplied by M. C. Rabenhorst). Pore linings are usually thin and can be difficult to see. In (B) a thin section shows black pore linings around root channels that are approximately 1 mm in diameter.
Photograph supplied by L. P. Wilding
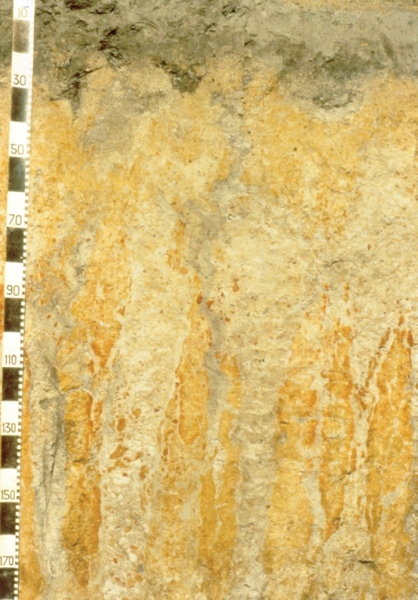
Figure 6a. Examples of redox depletions. (A) A soil profile (Plinthaquic Paleudalf) showing well-developed redox depletions more than 140 cm long in the B horizon. Iron depletions and clay depletions appear similar in photographs.
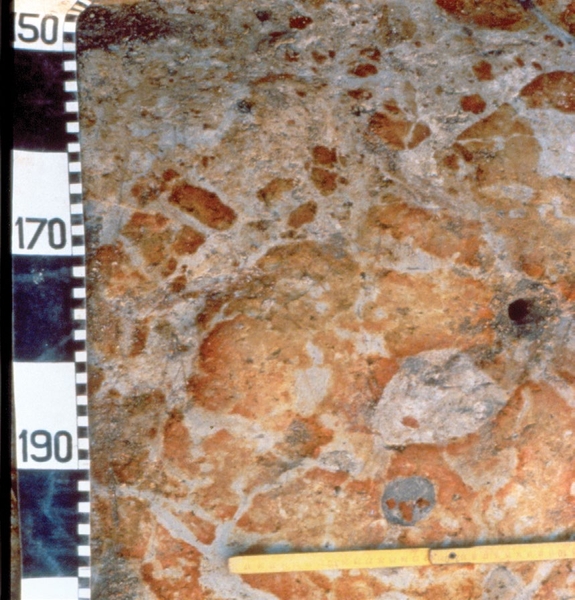
Figure 6b. Gray Fe depletions (ID) occur primarily along ped surfaces as shown in this horizontal section at a depth of approximately 170 cm. Iron masses (IM) lie parallel to some depletions.
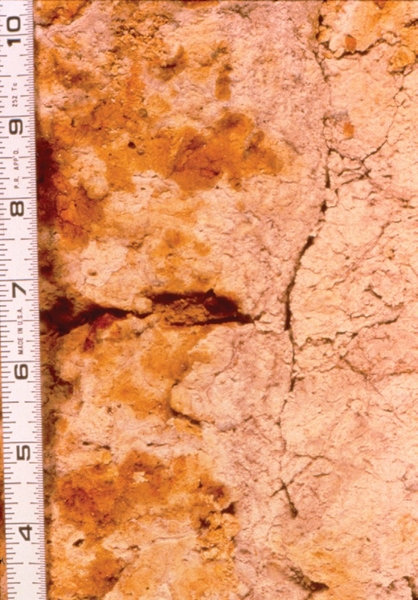
Figure 6c. Clay depletions lie along ped surfaces (CD) and some root channels. The Fe masses (IM) occur in the matrix. Scale is in inches.
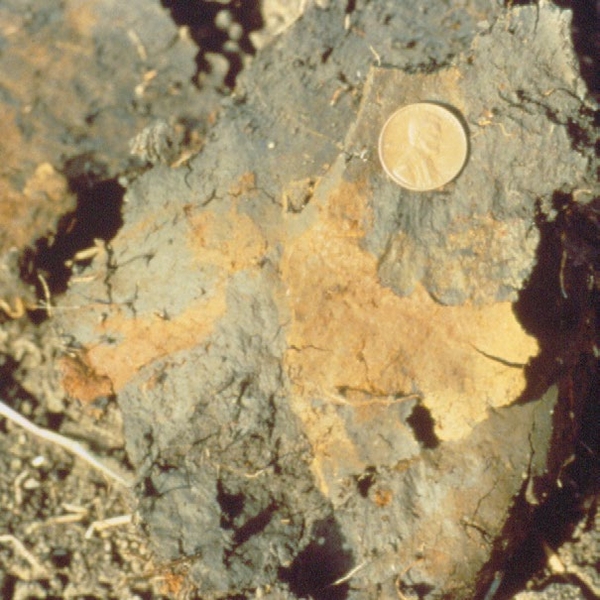
Figure 7. A reduced matrix where the yellowish color has developed within 30 minutes of being exposed to air. Before exposure to air, the entire sample had the gray color shown.
Formation of Redoximorphic Features
To understand how redoximorphic features form, it is necessary to have a basic understanding of the chemistry of Fe and Mn oxides and how oxidation and reduction affect soil color.
Soil Color and the Oxidation-Reduction States of Fe and Mn
In subsoil horizons, Fe oxide minerals give the horizons red, brown, yellow, or orange colors depending upon which Fe minerals are present (examples shown in Table 3). Manganese oxide minerals produce black colors. The Fe and Mn oxides tend to coat (like paint) the surfaces of sand, silt, and clay particles. Without the oxide “paint” on their surfaces, these particles are gray.
The red, brown, yellow, and orange colors occur when Fe is in its oxidized state (Fe III). Black colors also occur when Mn is in its oxidized state, Mn (III) or Mn (IV). Both oxidized Fe and Mn can be chemically reduced under certain soil conditions. Reduction occurs when each ion (i.e., Fe (III) or Mn (III or IV)) accepts electrons from another source such as organic matter. Reduced Fe (or ferrous Fe) is indicated by Fe (II), and reduced Mn (or manganous Mn) by Mn (II). When these elements are reduced in a soil several things happen: (1) Fe and Mn oxide minerals begin to dissolve in water; (2) the soil colors change to gray; and (3) the reduced Fe (II) and Mn (II) ions diffuse through or move with the soil water to other parts of the soil horizon or may be leached from the soil. When Fe and Mn are in their reduced form, they have much less coloring effect on soil than when they occur in their oxide forms. The gray soil color is produced primarily by the natural color of sand, silt, clay particles, although Fe (II) may also have some coloring effect (Ponnamperuma, 1972).
Iron (III) and Mn (III and IV) are reduced by bacteria decomposing organic matter under anaerobic conditions. In an aerobic soil that is moist but not saturated, bacteria consume and reduce O2 in air-filled soil pores during the decomposition of organic tissue. Anaerobic soils are saturated such that most pores will be filled with water unless air has been entrapped in some pores. Bacteria in these soils consume O2 dissolved in the soil water as they decompose the organic matter. When the dissolved O2 is gone, the soil water is said to be reduced. As bacteria continue to decompose organic matter, they also produce organic chemicals that can reduce NO3- (nitrate) to N2 gas (denitrification), and reduce minerals composed of Mn (III) and Fe (III) oxides. These chemical reactions occur in sequence, with O2 being reduced first, then NO3-, Mn (III or IV) oxides, and finally Fe (III) oxides. The Fe oxide minerals will not be reduced until after O2, NO3-, and Mn oxides that occur near the Fe oxides have been reduced. These are not the only reduction reactions that occur in waterlogged soil, but they are the main ones of interest for understanding redoximorphic features.
Bacteria decomposing organic matter such as dead root tissue consume soluble carbon in the tissue. If the source of the soluble carbon is primarily roots, then reduction will occur in the soil near the root. However, if organic compounds are dissolved in the water, then reduction could occur throughout the soil horizon wherever pores are filled with water. It appears that the carbon must be water-soluble because total soil organic matter, much of which may not be water-soluble, is not all used to produce reducing conditions (Daniels and Buol, 1992).
Formation of Iron Depletions and Clay Depletions
Formation is similar for iron and clay depletions, and both may occur within the same or adjacent horizons. It is easiest to visualize these features forming around roots that grow along stable macropores. Stable macropores are required so that features continue to enlarge as succeeding roots grow and die along the same macropore. Field studies indicate that the features are best expressed in dense horizons having a low saturated hydraulic conductivity (Daniels et al., 1968; Ransom et al., 1987; and Vepraskas and Wilding, 1983a). Such horizons can also perch water (Blume and Schlicting, 1985).
Roots growing along a structural crack or channel provide the energy source (organic matter) needed by microbes for Fe-reduction (Figure 8a). When the root dies and the macropore is filled with water, bacteria will consume the root tissue and utilize (reduce) oxygen in the water if soil temperatures are high enough for the bacteria to be active (generally > 5°C). Following the reduction of O2 and NO3-, the oxide minerals composed of Mn (III or IV) and Fe (III) in the soil along the channel will be reduced (Figure 8b). The dissolved Mn (II) and Fe (II) ions may diffuse into the matrix, where they can be oxidized (if air has been entrapped) to form redox concentrations. The newly formed bleached layer where Fe and Mn have been removed along the channels is a redox depletion, specifically an Fe depletion. The Fe depletion differs from the soil matrix primarily in its lower content of Fe and Mn. It must have a color chroma < 2 to be considered a redoximorphic feature.
Removal of Mn and Fe oxides may cause the clay along the channel to disperse when wet. During downward movement of water along the macropore, gray-colored clay may become suspended in the water and move to a lower horizon. The feature with its clay removed is a clay depletion (Figure 8c). Gray clay coatings are usually found along macro- pores in the horizons that lie below the clay depletions.
Because of the need for an energy source such as soluble carbon to enhance reduction, it appears that Fe depletions and clay depletions will form along macropores such as root channels and ped surfaces where roots grow. Iron depletions may also form within the soil matrix if carbon-rich waters flow through the soil matrix and produce reducing conditions there.
Iron depletions and clay depletions probably form slowly in most instances. For these features to enlarge, successive roots probably have to grow along the macropore, die, and then decompose to induce the reduction of Fe necessary to enlarge the depletion features. Thus, large depletion features (> 2 mm in width) probably form over time around stable macropores. Such macropores can occur in horizons having little bioturbation, for instance dense B horizons with structural aggregates > 3 cm in diameter. In A horizons having much bioturbation, small aggregates, and an abundance of organic staining material, depletion features are difficult to see because of physical disruption, small size, and masking by organic material.
Formation of Redox Concentrations
Pore linings occur along ped surfaces as well as root channels (Figure 5 and Figure 9a-b). They are also found on the roots of plants that can transport oxygen to their roots in saturated soils (Figure 9c). These form by diffusion of reduced Fe and Mn ions toward aerated macropores, where the ions are oxidized adjacent to the macropores and even on root surfaces (Fisher and Stone, 1991). If both Fe and Mn are in solution, the Fe tends to precipitate first because it will oxidize at a lower Eh value than will Mn (Collins and Buol, 1970). Therefore, pore linings may appear to consist of clearly separated Mn oxides (in the macropore) and Fe oxides (in the matrix). Such a distribution pattern indicates that the ions were diffusing in a direction away from the Fe oxides and toward the black Mn oxides.
Masses, nodules, and concretions. Formation of these features is not well understood. The ways such features form appear similar, and which feature forms in a horizon is thought by some to depend on how fast air penetrates into a reduced horizon. When a horizon has been repeatedly saturated, reduced, and drained, Fe masses will form where air penetrates into the horizon slowly to oxidize reduced Mn and Fe ions (Blume, 1988). Nodules and concretions are believed to form when air penetrates quickly, perhaps at a point into the wet matrix containing Fe (II) and Mn (II).
Formation of Reduced Matrices
A reduced matrix forms simply by the reduction of Fe in the soil. This requires that the soil horizon be saturated to exclude air for a long enough time so that Fe reduction occurs. Reduced matrices can only occur where soluble organic matter is present and microorganisms are active.
Rates of Feature Formation
Redox concentrations and depletions have been created in laboratory experiments quickly for several kinds of features (Vepraskas and Bouma, 1975). Vepraskas and Guertal (1992) calculated that the time required to form a 2-mm-thick Fe depletion around a root channel varied from less than one year to more than 100 years, depending upon how long reducing conditions occurred within the channel and how much Fe was in solution each day.
Reduced matrices can be produced in the laboratory by taking a sample of red or brown (e.g., 2.5Y 5/6) soil and submerging it in water to which common table sugar has been added to feed bacteria. The reduced matrix forms when most of the Fe oxides have been reduced and the soil turns gray (chroma < 2). Examples of color changes during such experiments are given by Daniels et al. (1973). A minimum amount of Fe (II) must oxidize before a change in color upon exposure to air is apparent. This will vary with the clay content of the soils, but Fe oxide concentrations >2% (weight basis) appear to be necessary as a general rule, because at lower Fe levels the soil color tends to be dominated by the grayish color of quartz comprising the sand and silt fractions. The results from laboratory studies suggest that under high temperature (i.e., approximately 72°F), high organic carbon levels, and an active microbial population, reduced matrices could form within ten days of submergence (Meek et al., 1968).
Chemical analyses of Fe in root tissue have shown that pore linings can begin to form around aerated roots within seven days of flooding in rice paddies once Fe has been reduced within the soil matrix (Chen et al., 1980). Pore linings continue to enlarge throughout the growing season. It is not clear how long flooding must persist before pore linings become visible to the naked eye. While the time required will probably vary among soils, it is reasonable to assume that periods of flooding greater than 30 days are sufficient to produce visible pore linings. (Chen et al., 1980).
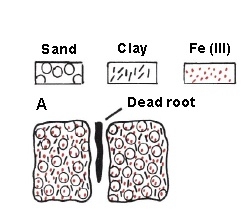
Figure 8a. Schematic illustration showing the formation of redox depletions. The process begins with: (A) a decomposing root lying in a channel. When the channel fills with water.
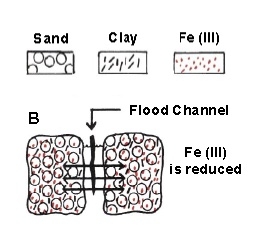
Figure 8b. When the channel fills with water, Fe in soil along the channel is reduced when the root’s decomposition occurs anaerobically. The reduced Fe (II) may diffuse into the soil matrix. An Fe depletion occurs along the channel when enough Fe has been lost to produce a color chroma of 2 or less.
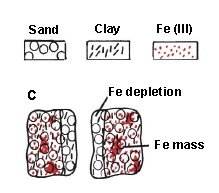
Figure 8c. Iron masses form when the Fe (II) in the matrix oxidizes to Fe (III). The loss of Fe makes clay along the channel dispersible, and water moving along the channel may illuviate this clay to a lower horizon.
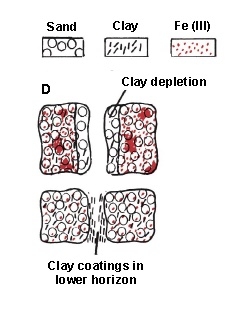
Figure 8d. Clay depletions form where the clay has been removed.
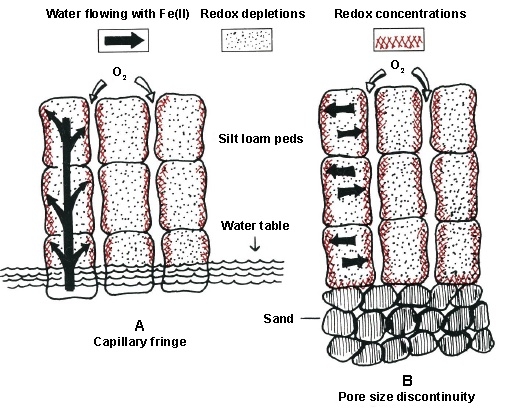
Figure 9a-b. Different hydrologic settings that create a pattern of redoximorphic patterns where redox concentrations occur around macropores and redox depletions occur within the matrix. In (A) and (B) the concentrations occur around aerated macropores when the horizons are unsaturated, but soil matrics are reduced.
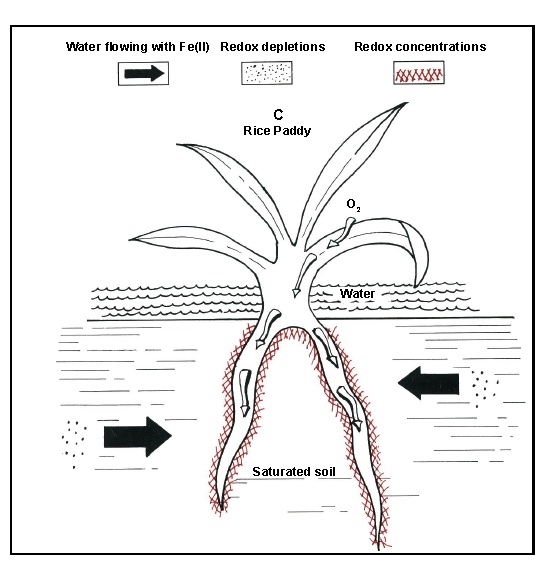
Figure 9c. The horizon in the rice paddy is saturated and reduced, but oxidizing conditions occur around rice roots becouse the plant can transport oxygen to its roots.
Describing Redoximorphic Features
Redoximorphic features must be described for every horizon. The morphological characteristics to be identified differ among the types of redoximorphic features. Noting the relationship of each feature to the macropores or matrix is necessary for exact interpretations. Description of redoximorphic features is similar to the description of mottles formerly used. Size, abundance, and contrast terms that can be used in the description are defined in Table 1. An example of a profile description form that can be used to aid in describing these features is shown in Table 2.
- Redox concentrations. Describe type, color, inferred composition (Fe, Mn, or Fe/Mn), size, abundance, contrast, and whether the concentrations occur along macropores or within the matrix. Boundaries of nodules and concretions can be described as sharp or diffuse.
- Redox depletions. Describe type, color, size, abundance, contrast, and whether the depletions occur along macropores or within the matrix. Care must be taken to distinguish between true redox depletions and illuvial coatings and infillings. Silt particles can be illuviated into horizons and form coatings along macropores. Similar features may occur where sand infills burrows or root channels. These coatings and infillings are not redoximorphic features and are not clay depletions; clay depletions form in place. Illuvial sand and silt coatings frequently have a color identical to that of an overlying A or E horizon, but exceptions occur.
-
Reduced Matrices. Describe reduced matrix color, oxidized color, and time for color change to occur. Reaction to α, α'-dipyri-dyl dye that detects ferrous iron may be used to identify a reduced matrix only when no other redoximorphic features are present (Soil Survey Staff, 1992).
- Macropores. Macropores are defined as both planar ped surfaces and root channels (tubular pores) having a diameter > 1 mm. Describe type, size, and abundance.
| Horizon | Depth | Matrix Color(s | Redox Concentrations (percent/size/color/location) | Redox Depletions (percent/size/color) | Text. Class | Structure | Reaction to: | Bndy. | Comment | |||||||
|---|---|---|---|---|---|---|---|---|---|---|---|---|---|---|---|---|
| Fe Masses | Fe/Mn Concretions/Nodules | Pore Linings | In Matrix | Along Pores | Grade | Size | Shape | HCI | H2O2 | Dipyr. | ||||||
|
I |
||||||||||||||||
Interpreting Water Movement Using Redoximorphic Features
During field-testing of the proposed aquic conditions, it was found to be impossible to define characteristic sets of redoximorphic features that formed with endosaturation but not with episaturation. The same kinds of features occurred with both types of saturation. Therefore, redoximorphic features should be interpreted only as indicators of where oxidation and reduction occur within a soil horizon. Redox depletions generally show where reduction occurs (in the matrix or in the macropores), while redox concentrations show where oxidation occurs within horizons.
The spatial relationship of redox depletions to redox concentrations can be used to interpret how water and air move through the macropores and matrix of a soil horizon. In general, it has to be assumed that water moves from redox depletions into or toward redox concentrations. Inferring water movement between or among horizons may be difficult except where the same redoximorphic features extend across horizon boundaries.
Interpreting directions of water movement from the pattern of redoximorphic features is easiest when the features have a consistent relationship to the soil structure and macropores. For redoximorphic features to have a consistent relationship to macropores (e.g., redox depletions only along ped surfaces), the macropores must be stable and spaced widely enough so that the growing features do not overlap.Basic principles will be illustrated with four examples. In all cases, the redoximorphic features must be assumed to be contemporary.
Example 1: Redox depletions occur around macropores, and redox concentrations occur within matrix (Figure 4b, Figure 6a, Figure 6b, and Figure 6c). This arrangement of redoximorphic features indicates water infiltrates the horizon along macropores, and reducing conditions primarily develop within the macropores, or occur there for longer periods than in the matrix. Air can be trapped within the matrix, in part because water-filled macropores surround an air-filled matrix.
This morphology occurs in soils with perched saturated layers, and is found within and above the slowly permeable horizon that is perching water. Thus, this morphology pattern can occur in dense horizons whose matrix has a low saturated hydraulic conductivity. The morphology is found in horizons with episaturation (i.e., perched saturated layers) or with endosaturation if the macropores extend to depths of 2 m or below. Detailed descriptions have been given by Fanning and Fanning (1989, mottling model II), Vepraskas and Wilding (1983a), and Blume and Schlicting (1985) among others.
Example 2: Redox concentrations occur around macropores, redox depletions occur within matrix (Figure 5). This arrangement of redoximorphic features indicates that the matrix is wet for periods long enough for reducing conditions to be maintained within the matrix. The macropores become aerated while the matrix is still reduced. The movement of water and reduced substances is from the matrix toward the macropores.
This morphology has been found with episaturation, endosaturation, and probably occurs in anthric saturation as well (Veneman et al., 1976). Horizons with this morphology may be unsaturated or saturated. Unsaturated horizons can be found in at least two cases (Figure 9a-b). The horizon can be saturated and still have aerated macropores if plants grow in the saturated horizon and transport air to their roots (Figure 9c). Most notable of these plants is rice, which, like similar plants, has air-conducting spaces in its roots.
Example 3. Redox depletions and concentrations have no consistent relationship to macropores. This example can be found in sands or materials with small aggregates where macropores are either not stable or are relatively small and closely spaced such that water and air movement into the horizon does not follow the same macropores after each infiltration event. Water and air may also move through both macropores and matrix. This pattern of features is difficult to interpret except to say that reduction and oxidation occur randomly through the horizon over time. This example may occur with either episaturation or endosaturation.
Example 4. Redoximorphic features have a distribution that combines two of the three examples. The above examples are idealized versions of well-recognized morphological patterns. Soils can have one horizon with one group of features overlain or underlain by a horizon containing another group. Because this condition is common, it is important to describe the features individually rather than to expect ”sets” of features to occur throughout the soil.
Interpretation Problems
Problem Soils and Oxyaquic Conditions
Redoximorphic features do not form in all soils, nor are all the redoximorphic features that are present in a horizon today representative of current aquic conditions. When redoximorphic features are not present, or are not well expressed, the occurrence of saturation and reduction must be confirmed by observing such conditions directly, or by long-term monitoring studies. Redoximorphic features are not found in soils with low amounts of soluble organic carbon, high (> 7) pH, low temperatures, low amounts of Fe, or aerated groundwater. Therefore, it is stipulated in the Keys to Soil Taxonomy that when redoximorphic features are not present, a positive reaction to the α, α'-dipyridyl dye solution is sufficient to meet the requirements for redoximorphic features.
A soil has an oxyaquic condition when it is periodically saturated but not reduced. Such soil will not have redoximorphic features and will not show a positive reaction to α, α'-dipyridyl dye at any time during a typical year.
Relationships of the Abundance of Features to Lengths of Saturation and Reduction
The abundance of redox depletions is generally related to how long a soil is reduced. Feature abundance is not directly related to how long a soil horizon is saturated. Vepraskas and Guertal (1992) compared the abundance of clay depletions found in five different soils to periods of saturation and reduction. Data came from different investigators, but, in general, abundance of clay depletions ranged from 18 to 79% for the different soils. All horizons were found to be saturated for up to six months during some years. During ”dry” years they were saturated for three months or less. Clearly, the length of time a horizon was saturated could not be predicted by measuring the abundance of redox depletions along macropores. It was noted, however, that in the horizon with the fewest clay depletions (18%), the oxidation-reduction potential measurements (Eh values) showed Fe reduction was occur- ring for less than one month during the year of measurement, while the horizon with the most clay depletions was reduced for up to four months of the year. The data were not extensive or complete across all soils, but they do suggest that the abundance of redox depletions will be more closely related to how long soils are reduced rather than how long they are saturated.
It also has been found that in some landscapes reduction does not commence as soon as the soils become saturated, and, in some cases, horizons can be reduced without being saturated (Daniels et al., 1973; Vepraskas and Wilding, 1983b). More work should be done showing how the abundance of redox depletions is related to periods of saturation and Fe reduction. Studies should consider different landscape positions, because it appears that different relationships will be found among positions.
Relict Redoximorphic Features
A major problem that remains unsolved is how to identify relict (or fossil) redoximorphic features. Whenever redoximorphic features are described, it is assumed that the features represent current conditions of saturation and Fe reduction. Unfortunately, there is no clear way to ensure that the features we are describing represent contemporary conditions.
Micromorphologists must determine if it is possible to identify relict redoximorphic features using simple field techniques. Some work has been done on this topic, and several feature characteristics suggest whether features are relict or contemporary:
- Feature boundary characteristics. Fe-Mn nodules and concretions that are actively forming in situ should have gradual or diffuse boundaries with the soil matrix, and may have an irregular surface. In some cases these may be described as “halos,” or “ferrans” (Wilding et al., 1983). Nodules or concretions that are degrading tend to have sharp boundaries with the matrix and show many grains protruding from the surface. Some may even have smooth surfaces that resemble rounded pebbles.
- Location to macropores. Some features only form along macro- pores. For example, clay depletions have been described as forming along stable macropores in which roots repeatedly grow. To be considered representative of current conditions, the clay depletions must occur along macropores and must not be overlain by Fe-rich clay coatings, which indicate that Fe is no longer being stripped from around the macropore.
- Feature color. Redox concentrations generally consist of the Fe minerals goethite, lepidocrocite, ferrihydrite, or jarosite. These concentrations are not believed ever to consist of hematite. Because each type of Fe oxide mineral has a characteristic range of hues, the colors of features might be used to identify those that could be contemporary from those that must be relict. Examples of diagnostic hues are given in Table 3 and were developed in conversations with Dr. Rob Fitzpatrick (CSIRO, Adelaide, Australia) and Dr. Darrell Schultze (Purdue University).
| Fe Mineral | Hue* | |
|---|---|---|
| Relict redox concentrations (nodules, concretions, masses) | Hematite | 10R, 5R, 2.5YR |
| Contemporary redox concentrations (masses, pore linings) | Ferrihydrite | 5YR |
| Lepidocrocite | 7.5YR | |
| Goethite | 7.5YR, 10YR | |
| Jarosite | 2.5Y | |
*Hues are not considered reliable indicators when color values are < 3.5 and chromas are < 3.5. Colors are too dark under these conditions to see the hue reliably. ↲
Redoximorphic Features Found under Anthric Saturation
The term “aquic conditions” includes anthric saturation, which is found under controlled flooding for crop (rice) production. The redoximorphic features discussed were not tested for rice paddies. While there is no reason to expect different kinds of features will be found under anthric saturation than have been identified for endosaturation and episaturation, this should be confirmed.
Representative Profile Examples
The description of redoximorphic features is illustrated here for two different soils. The first example illustrates features found in a recently created wetland. The second example illustrates features found in a seasonally saturated soil in the Gulf Coastal Plain—a soil much older than the first and containing a more complex arrangement of features. These descriptions are not complete in that soil consistence and pH are not listed; nor are other special features listed that do not pertain to saturation and reduction. Redoximorphic features are noted in italics, and soil colors are for moist soil.
|
Location: |
Des Plaines River Wetlands Demonstration Site, Wadsworth, Illinois. |
|
Landscape Position: |
Edge of a deep marsh (wetland no. 4). |
|
Kind of Saturation: |
Piezometer measurements confirmed saturation extended from the surface to a depth of 2 m, so the soil had endosaturation. |
|
Parent Material: |
Upland constructed of alluvial deposits found at the site. |
|
Vegetation: |
Wetland reeds, sedges, and cattails. |
|
Described by: |
M. J. Vepraskas, J. P. Tandarich, and J. L. Richardson. |
|
Date Described: |
August 1991 |
|
Dye Used: |
α,α' dipyridyl in neutral ammonium acetate solution. |
|
Parent material: |
Wetland constructed of alluvial deposits found at the site. |
|
Classification: |
Aeric Endoaquept |
|
Ag 0 to 10 cm |
Very dark gray (5YR3/1) silty clay loam; very few thin, faint yellowish red (5YR 5/8) pore linings along 1 mm diam. root channels; strong, very fine subangular blocky structure; positive reaction to dye; clear smooth boundary. |
|
Bg 10 to 41 cm |
Dark gray (5YR 4/1) silty clay loam; very few thin, faint yellowish red (5YR 5/8) pore linings along 1 mm diam. root channels; strong, medium subangular blocky structure; positive reaction to dye; abrupt smooth boundary. |
|
2C 41 to 58+ cm |
Brown (10YR 5/3) silty clay loam; common thin, distinct strong brown (7.5YR 5/8) pore linings along some root channels, but also common, faint, light grayish brown (10YR 6/2) Fe depletion coatings along other channels; massive structure; no reaction to dye. |
Comments and Interpretations
The soil was on the edge of a wetland created two years before the soil was sampled. The soil had aquic conditions because it was saturated, Fe reduction was occurring, and redoximorphic features were present. Endosaturation was confirmed by piezometer measurements, and Fe reduction was confirmed by a positive reaction to the α, α'-dipyridyl dye at the time of sampling.
The redoximorphic features found in the Ag and Bg horizons correspond to those shown in Figure 5 and Figure 9c. The soil matrix is probably saturated and reduced for at least six months each year because the marsh is filled with water for this period. Reduced Fe (II) is produced in the matrix, and it moves toward the aerated root channels, where it is oxidized and precipitated in the form of pore linings.
In the C horizon, the redoximorphic features were forming according to two different models, those shown in Figure 8a, Figure 8b, Figure 8c, Figure 8d, Figure 9a-b, and Figure 9c. The source of soluble carbon apparently comes from around roots. The reduction of Fe is occurring around root channels as indicated by the Fe depletions. This may happen when roots die. Aeration is also occurring in root channels, possibly where live roots are currently growing. Therefore, Fe is being dissolved around some root channels and is then precipitating around others. While this pattern of features is more complicated than that found in overlying horizons, it is a reasonable pattern to expect in horizons saturated for long periods but where soluble organic carbon is concentrated only along root channels, which are also the major zones of aeration. Obviously, the reduction of Fe and oxidation of Fe cannot occur around the same channel at the same time.
|
Location: |
Montgomery County, Texas. |
|
Landscape Position: |
Footslope, with slope of 0–1%. |
|
Kind of Saturation: |
Tensiometer and piezometer measurements were made in 1978 and 1979, and they confirmed that the soil had saturated layers between the depths of the surface and 1.9 m. The soil technically had episaturation that was very close to being endosaturation. |
|
Parent Material: |
Pleistocene fluvial and deltaic coastal plain sediments. |
|
Vegetation: |
Forest, predominantly loblolly pine (Pinus-taeda L.). Described by: M.J. Vepraskas, L.P. Wilding, R. Miles, and T. Sobecki. |
|
Date Described: |
August 1977. |
|
Classification: |
Splendora fine sandy loam, Aeric Glossaqualf. |
|
Ac 0-8 cm |
Dark grayish brown (10YR 4/2), fine sandy loam; weak, fine, granular structure; many roots ranging from < 1 mm to over 30 mm in diam.; clear smooth boundary. |
|
Ec 8-50 cm |
Brown (7.5YR 5/3) fine sandy loam; very weak, medium subangular blocky structure (nearly massive); many fine (< 5mm), few coarse (> 15 mm) roots; few (< 1%) medium, dark brown (7.5YR 3/2 and 4/4) Fe nodules with sharp boundaries; many fine, few coarse, distinct, strong brown (7.5YR 5/ 6) Fe masses in red interiors; many fine, faint, brown (7.5YR 5/2) Fe depletions along ped surfaces and some root channels; gradual smooth boundary. |
|
A / Btc 50-65 cm |
Variegated color pattern consists of 35% light yellowish brown (10YR 6/4), 35% yellowish brown (10YR 5/6), and 30% light brownish gray (10YR 6/2) fine sandy loam; very weak, coarse, subangular blocky structure; common fine roots; common (10%) medium Fe nodules, most having sharp boundaries but some having yellowish brown (10YR 5/6) diffuse boundaries; many medium, distinct, yellowish brown (10YR 5/6) Fe masses at ped interiors; many fine and medium, faint, light browish gray Fe depletions along root channels; clear smooth boundary. |
|
B / Atc 65-118 cm |
Variegated color pattern consisting of 50% pale brown (10YR 6/3), 25% reddish brown (5YR 4/4), and 25% yellowish red (5YR 5/8) sandy clay loam; weak, very coarse (5–10 cm) prismatic units; few fine roots generally along prism surfaces; Fe nodules same as above; ped surfaces covered by light brownish gray (10YR 6/2) clay depletions usually 6-13 mm thick, but occasionally up to 50 mm thick; many medium, distinct, reddish brown and yellowish red Fe masses; gradual wavy boundary. |
|
E’c 118-143 cm |
Variegated color pattern consists of 55% pinkish gray (7.5YR 6/2) 45% red (2.5 YR 4/8), 4% yellowish red (5YR 4/6), and 1% strong brown (7.5YR 5/6), gravelly, fine sandy loam; weak coarse (5-15 cm) prismatic structure; very few roots; ped surfaces covered by pinkish gray clay depletions 12–50 mm thick; many medium, distinct red (2.5YR 4/8, dry) Fe masses occur at ped interiors; many (25%) very coarse Fe nodules, those occurring at ped faces having sharp boundaries, but those at ped interiors having diffuse boundaries; irregular, wavy boundary. |
|
2Btxc 143-200 cm |
Variegated color pattern consists of 65% yellowish brown (10YR 5/8), 20% red (2.5YR 4/8), and 15% light brownish gray (10YR 6 1 2) sandy clay loam; weak, coarse (3–15 cm), prismatic structure; few medium and fine roots along primary ped surfaces; thick (3–6 mm), continuous, light brownish gray clay coatings along ped surfaces; common distinct red pore linings along some ped surfaces; common, reddish brown (5YR 4/4) Fe nodules having diffuse boundaries within peds; gradual smooth boundary. |
|
2Bt 200-240 cm |
Yellowish brown (10YR 5/8) matrix; loam; moderate fine angular blocky structure; few root channels; common (4%) fine, faint, dusky red (l0YR 3/4) pore linings on ped surfaces; common (8%) coarse (up to 2 × 2 cm), faint, light gray (l0YR 7/2) Fe depletions along channels; (boundary not observed—sampled from a core). |
Comments and Interpretations
Aquic conditions were confirmed by detailed measurements of saturation (using tensiometers), reduction (using Pt microelectrodes), and a detailed examination of redoximorphic features. The soil resembles that shown in Figure 6a. The soil was saturated from the surface to a depth of 1.8 m for three to five months during the two years of measurements. The saturated layers were perched on top of the 2Bxtc horizon, but the zone of saturation extended to a depth of nearly 2 m. For all practical purposes, the soil had endosaturation, but by definition episaturation occurred because saturation did not extend to 2 m. Iron reduction was found to be occurring for up to five months (in 1979) between the depths of 76 and 152 cm.
Redoximorphic features were described in all horizons between and including the E and 2Bt horizons. Despite the complex color patterns described, the kinds of redoximorphic features present are those expected with the model shown in Figure 8a, Figure 8b, Figure 8c, and Figure 8d. Saturation and reduction appeared to occur along root channels and ped surfaces as indicated by the redox depletions found there. The reduced Fe and Mn ions diffused into ped interiors where they were oxidized to form Fe masses or Fe nodules. The terms “Fe masses” and “Fe nodules” imply the features were composed primarily of Fe, but Mn was probably within them as well. The Fe nodules present were both relict and contemporary. The contemporary nodules had diffuse boundaries and were at ped interiors. Relict nodules with sharp boundaries occurred in redox depletions. These nodules may have been at ped interiors at some point, but now they are along macropores where reduction occurs. The 2.5YR hue found for some redox concentrations in the E’c and 2Bxtc horizons indicates that some of the Fe in these features is hematite (Table 3). This suggests that these features are very old and may not currently be enlarging.
Horizons with clay depletions were underlain by horizons containing thick, gray clay coatings. The gray clay may have come from the clay depletions in the overlying horizons. The gray clay coatings are technically not Fe depletions in the normal sense because the clay had its Fe removed before it was illuviated.
Conclusions
Aquic conditions are used to classify seasonally saturated and reduced soils according to Soil Taxonomy. Soils with aquic conditions are saturated, reduced, and have redoximorphic features. Recognition of redoximorphic features will improve the identification and interpretation of features formed in the soil by the processes of saturation and reduction. Redoximorphic features must be calibrated to specific periods of saturation and reduction in individual landscapes before the features themselves can be used to interpret how long a specific soil is saturated and reduced each year. Redoximorphic features only show that the processes of saturation and reduction have occurred in the soil in the past. Measurements of these processes must be used to verify locally that the processes are still occurring in the soil.
The redoximorphic features described in this bulletin will not be found in all soils that are saturated and reduced. Soils without any Fe pose the most obvious problem in this regard. For these and other soils that are saturated and reduced, but do not have redoximorphicfeatures, additional features will probably have to be identified and used at the local level.
References
Blume, H. P. 1988. The fate of iron during soil formation in humid-temperate environments. pp. 749-777. In J. W. Stucki, B. A. Goodman, and U. Schwertmann (eds.). Iron in Soils and Clay Minerals. D. Reidel Publ. Co., Dordrecht, Netherlands. ↲
Blume, H. P., and E. Schlicting. 1985. Morphology of wetland soils. pp. 161- 176. In Anonymous (ed.) Wetland soils: Characterization, classification, and utilization. Proc. of a workshop held March 26 to April 5, 1984. Int. Rice Res. Inst., Los Banos, Philippines. ↲
Bouma, J. 1983. Hydrology and soil genesis of soils with aquic moisture regimes. pp. 253-281. In L. P. Wilding, N. E. Smeck, and G. F. Hall (eds.). Pedogenesis and Soil Taxonomy. I. Concepts and Interactions. Elsevier, Amsterdam. ↲
Bouma, J. 1991. ICOMAQ Circular 11, March 15, 1991. Final report of the International Committee for the Classification and Management of Wet Soils. Agric. Univ., Wageningen, The Netherlands. ↲
Bullock, P., N. Federoff, A. Jungerius, G. Stoops, and T. Tursina.1985. Handbook for Soil Thin Section Description. Waine Res. Publ., Wolverhampton, U.K. ↲
Chen, C. C., J. B. Dixon, and F. T. Turner. 1980. Iron coatings on rice roots: Morphology and models for development. Soil Sci. Soc. Am. J. 44:1113- 1119. ↲
Childs, C. W. 1981. Field test for ferrous iron and ferric-organic complexes (on exchange sites on in water-soluble forms) in soils. Austr. J. Soil Res. 19:175- 180. ↲
Collins, J. F., and S. W. Buol. 1970. Effects of fluctuations in the Eh-pH environment on iron and/or manganese equilibria. Soil Sci.110: 111-118. ↲
Couto, W., C. Sanzonowicz, and A. De O. Barcellos. 1985. Factors affecting oxidation-reduction processes in an Oxisol with a seasonal water table. Soil Sci. Soc. Am. J. 49:1245-1248. ↲
Daniels, R. B., and S. W. Buol. 1992. Water table dynamics and significance to soil genesis. pp. 66-74. In J. M. Kimble (ed.). Proc. Eighth Int. Soil Corr. Meetings (VIII ISCOM): Characterization, classification, and utilization of wet soils, USDA, Soil Cons. Serv., National Soil Survey Center, Lincoln, NE. ↲
Daniels, R B., E. E. Gamble, and L. J. Bartelli. 1968. Eluvial bodies in B horizons for some Ultisols. Soil Sci. 106:200-206. ↲
Daniels, R. B., E. E. Gamble, and S. W. Buol. 1973. Oxygen content in the ground water of some North Carolina Aquults and Udults. pp.153-166. In R. R. Bruce, K. W. Flach, and H. M. Taylor (eds.). Field Soil Water Regime. SSSA Spec. Publ. No. 5, Soil Sci. Soc. Am., Madison, WI. ↲
Fanning, D.S., and M. C. B. Fanning. 1989. Soil Morphology, Genesis, and Classification. J. Wiley and Sons, New York, NY. ↲
Fisher, H. M., and E. L. Stone. 1991. Iron oxidation at the surfaces of slash pine roots from saturated soils. Soil Sci. Soc. Am. J. 55:1123-1129. ↲
Franzmeier, D. P., J. E.Yahner, G. C. Steinhardt, and H. R. Sinclair, Jr. 1983. Color patternsand water table levels in some Indiana soils. Soil Sci. Soc. Am. J. 47:1196-1202. ↲
Hyde, A. G. and R. D. Ford. 1989. Water table fluctuation in representative Immokalee and Zolfo soils of Florida. Soil Sci. Soc. Am. J. 53:1475-1478. ↲
Meek, B. D., A. J. MacKenzie, and L. B. Grass. 1968. Effects of organic matter, flooding time, and temperature on the dissolution of iron and manganese from soil in situ. Soil Sci. Soc. Am. Proc. 32:634-638. ↲
Moormann, F. R., and H. T. J. van de Wetering.1985. Problems in characterizing wetland soils. pp. 53-68. In Anonymous (ed.). Wetland soils: Characterization, classification, and utilization. Proc. of a workshop held March 26 to April 5, 1984. Int. Rice Res. Inst., Los Banos, Philippines. ↲
Ping, C. L., J. P. Moore, and M. H. Oark. 1992. Wetland properties of permafrost soils in Alaska. pp.198-205. In J. M. Kimble (ed.). Proceedings of the Eighth Int. Soil. Corr. Meeting (VIII ISCOM): Characterization, classification, and utilization of wet soils. USDA, Soil Cons. Serv., Nat. Soil Survey Center, Lincoln, NE. ↲
Ponnamperuma, F. N. 1972. The chemistry of submerged soils. Adv. Agron. 24:29-96. ↲
Ransom, M. D., N. E. Smeck, and J. M. Bigham. 1987. Micro-morphology of seasonally wet soils on the Illinoisan till plain, USA. Geoderma 40:83- 100. ↲
Ruhe, R. V., R. C. Prill, and F. F. Riecken. 1955. Profile characteristics of some loess-derived soils and soil aeration. Soil Sci. Soc. Am. Proc. 19:345-347. ↲
Soil Survey Staff. 1975. Soil Taxonomy: a basic system of soil classification for making and interpreting soil surveys. USDA-SCSAgric. Hndbk. No. 436. U.S. Govnt. Printing Office, Washington, DC. ↲
Soil Survey Staff. 1992. Keys to Soil Taxonomy, 5th edition. SMSS Tech. Monogr. No. 7. Virg. Polytech Inst. and State Univ., Blacksburg. ↲
Veneman, P. L. M., M. J. Vepraskas, and J. Bouma. 1976. The physical significance of soil mottling in a Wisconsin toposequence. Geoderma. 15: 103-118. ↲
Vepraskas, M. J., and L. P. Wilding. 1983a. Albic neoskeletans in argillic horizons as indices of seasonal saturation and iron reduction. Soil Sci. Soc. Am. J. 47: 1202-1208. ↲
Vepraskas, M. J., and L. P. Wilding. 1983b. Aquic moisture regimes in soils with and without low chroma colors. Soil Sci. Soc. Am. J. 47:280-285. ↲
Vepraskas, M. J., and W. R Guertal. 1992. Morphological indicators of soil wetness. pp. 307-312. In J. M. Kimble (ed.) Proc. Eighth Int. Soil Corr. Meeting (VIII ISCOM): Characterization, classification, and utilization of wet soils. USDA, Soil Cons. Serv., Nat. Soil Survey Center, Lincoln, NE. ↲
Wilding, L. P., M. H. Milford, and M. J. Vepraskas. 1983. Micromorphology of deeply weathered soils in the Texas coastal plains. pp. 567-574. In P. Bullock and C. P. Murphy (eds.) Soil Micromorphology. Vol. 2: Soil Genesis. A. B. Academic Publ. Co., Berkhamsted, Herts., U.K. ↲
Publication date: Aug. 12, 2015
Reviewed/Revised: March 5, 2025
TB-301
N.C. Cooperative Extension prohibits discrimination and harassment regardless of age, color, disability, family and marital status, gender identity, national origin, political beliefs, race, religion, sex (including pregnancy), sexual orientation and veteran status.