
Soil health is defined as the capacity of soil to function as a vital living ecosystem (Doran and Zeiss 2000), where healthy soil is believed to be highly productive, optimally functional, and naturally able to recover from disturbances (Doran and Parkin 1994; Kibblewhite et al. 2008). Numerous research groups have developed or are trying to develop soil health tests (Rinot et al. 2018) but none are widely accepted.
To maintain soil health, USDA-NRCS prescribes a core set of practices (USDA-NRCS 2023):
- Keep the soil covered as much as possible.
- Disturb the soil as little as possible.
- Keep plants growing throughout the year to feed the soil.
- Diversify as much as possible by using crop rotation and cover crops.
Many North Carolina farmers already use these core practices. For example, a corn-wheat-soybean rotation with conservation tillage provides all four soil health practices. The ability to use these practices depends on the specifics of the cropping system, but in general, crop rotation and conservation tillage have been important management practices implemented throughout the state for several decades.
Many farmers want to test their soil for soil health or want to know the usefulness of soil health testing. Currently, the tests most used in the United States are the Haney Soil Health Test (Haney) and the Cornell Comprehensive Assessment of Soil Health (CASH). The Haney test measures carbon dioxide respiration from microbes in the soil as a soil health indicator in addition to nutrient testing (Haney et al. 2006). The test is provided by commercial labs and costs around $55 per sample. The Cornell test was developed by the Cornell University Soil Health Testing Laboratory and includes multiple physical, chemical, and biological indicators in its evaluation (Moebius et al. 2007). The standard Cornell soil health test costs $130 per sample. The Haney and Cornell soil health tests do analyze more soil properties than traditional soil fertility tests. However, soil tests need regionalized research with field calibration to translate the numeric results to the correct interpretation of the soil health status. As soil health tests still have few field calibrations, there is no confirmation that these assessments of soil health indicators will lead to recommendations to improve soil health for different soils.
North Carolina has three physiographic regions—coastal plain, piedmont, and mountains. The Department of Crop and Soil Sciences, North Carolina State University, has maintained long-term soil management trials in each of these regions (Figure 1). The coastal plain long-term trial is located in Goldsboro and was established in 1999. The piedmont long-term trial is located in Reidsville and started in 1984, and the mountains long-term trial is in Mills River, in operation since 1994. Each trial has a unique management history, but two factors in particular were generally compared at Goldsboro (coastal plain) and Mills River (mountains). Those factors were tillage (no-till vs conventional tillage) and management (conventional vs organic management). At Reidsville (piedmont), researchers studied tillage intensity ranging from no-till to moldboard plowing (Table 1).
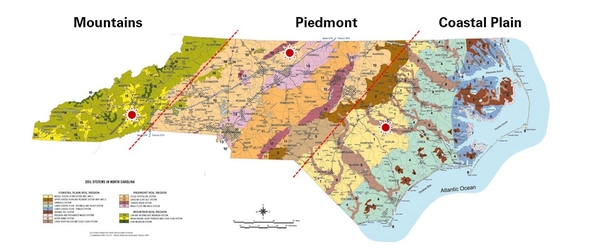
Figure 1. Map of long-term agronomic trials located across North Carolina. On the left is Mills River (mountains; 29 years), in the center is Reidsville (piedmont; 39 years), and on the right is Goldsboro (coastal plain; 24 years).
Soil Health Results
A group of soil scientists from NC State University sampled the long-term trials and performed Haney and Cornell tests to compare the soil health status in treatments with diverse long-term management practices. The Haney test was only conducted at Reidsville and Mills River.
There was substantial variation in soil health scores, ranging from 5 to 21 (Table 1), but any soil scoring 7 or more is considered to have “high” soil health on the Haney test. Results from this test determined that soil health was high for most of the treatments at the two locations, with the exception of spring moldboard at Reidsville, which scored “low” soil health. There was little differentiation between conservation and conventional tillage based on Haney ratings.
For the Cornell test, soils are rated on a scale from 0 to 100, with 0 indicating low soil health and 100 indicating high soil health. Overall soil health results from the Cornell tests did not demonstrate variance in soil health between treatments for the coastal plain or piedmont locations (Table 1). All treatments at these two locations received low soil health scores regardless of tillage or management. At the Mills River location, no-till organic management had greater soil health than no-till conventional management, conventional tillage treatments, and the control. In fact, no-till organic management at Mills River was the only treatment to receive a moderate soil health score on the Cornell test. However, yields were lower on the no-till organic than all other treatments.
An obvious difference in soil heath results exists between the Cornell and Haney tests, but for both of them it seems there is limited capacity to assign different ratings in North Carolina soils, even if very different management is used for a long period of time.
*Conventional tillage (CT), no-till (NT)
Soil Health Management Practices
The three long-term trials were designed to study the impact of minimal and conventional tillage practices on soil properties under differently managed cropping systems. However, the measurement of soil health via indicators of the Haney and Cornell tests indicated few variations caused by tillage or management regime, as noted in the results section. Moreover, the soil health ratings showed high soil health in Haney and low soil health in the Cornell test. The study demonstrated that either the soil properties varied considerably within the agronomic management systems, or the soil health parameters needed to be more sensitive to capture the impact of management practices (Roper et al., 2017). The study also revealed that the soil health tests need local calibration. As they were developed in another region of the U.S., the rating may need to be re-scaled for a correct interpretation of soil health status in Southern soils and climate.
The primary management practices that farmers can use to encompass the four soil health principles prescribed by USDA-NRCS include, but are not limited to, no-till, reduced tillage, cover crops, crop rotation, and mulching systems. Conservation tillage overlaps well with soil health principles and provides better soil health indices.
Despite the lack of confidence in today’s soil health methods, farmers should focus on utilizing proven soil health practices. A body of supporting literature details the advantages of conservation agriculture for increasing crop resilience and yields, while simultaneously promoting environmental protection. Other than conservation tillage, cover cropping is one of the best management practices to maximize soil cover, biodiversity, and living roots. Cover crops can provide organic matter input, conserve soil moisture, contribute to nitrogen fixation and usage by plants, improve nutrient cycling, alleviate compaction, increase water infiltration, protect soil from erosion, increase nutrient use efficiency, support beneficial microbial activity, increase crop productivity, suppress root pathogens and weeds, and reduce pesticide usage.
Crop rotation is another essential practice that can reduce the spread of pathogens and disease, and benefits soil health by maximizing biodiversity and living roots. Crop rotation can improve nutrient cycling and enhance nutrient use efficiency, retain soil moisture, reduce erosion, enhance water quality and conservation, increase species diversity for soil microbes to thrive, minimize insect pressure, and improve crop production. Management practices should be selected based on the specifics of the cropping system.
Conclusion
After comparing the Haney and Cornell soil health tests on three long-term trials, we saw very few differences in treatments for the measured properties. The Haney soil health ratings were mostly high, while the Cornell ratings were mostly low; we found no consistent relationship between soil health ratings and soil management. We recommend that farmers continue management practices for soil health and yield by using nutrient applications based on soil test results, rotating crops, and maintaining as much soil cover as possible by minimizing tillage. Due to the uncertainty surrounding the soil health measurements observed, we have found that currently available tests may not provide a consistent means for evaluating progress on soil health management.
References
Doran, J.W. and M.R. Zeiss. 2000. “Soil Health and Sustainability: Managing the Biotic Component of Soil Quality.” Appl. Soil Ecol. 15(1): 3–11.
Haney, R.L., E.B. Haney, L.. Hossner, and J.G. Arnold. 2006. “Development of a New Soil Extractant for Simultaneous Phosphorus, Ammonium, and Nitrate Analysis.” Commun. Soil Sci. Plant Anal. 37(11–12): 1511–1523.
Kibblewhite, M., K. Ritz, and M. Swift. 2008. “Soil Health in Agricultural Systems.” Philos. Trans. R. Soc. B Biol. Sci. 363(1492): 685–701.
Moebius, B.N., H.M. van Es, R.R. Schindelbeck, O.J. Idowu, D.J. Clune, and J.E. Thies. 2007. “Evaluation of Laboratory-Measured Soil Properties as Indicators of Soil Physical Quality.” Soil Sci. 172(11): 895–912.
Rinot, O., G. J. Levy, Y. Steinberger, T. Svoray, G. Eshel. 2018. “Soil Health Assessment: A Critical Review of Current Methodologies and a Proposed New Approach.” Sci. Total Environ. 648:1484-1491.
Roper, W., D. Osmond, J. Heitman, M. Wagger, C. Reberg-Horton. 2017. “Soil Health Indicators Do Not Differentiate Agronomic Systems in North Carolina Soils.” Soil Sci. Soc. Amer. J. 81:828-843. Doi: 10.2136/sssaj2016.12.0400.
U.S. Department of Agriculture-Natural Resources Conservation Service. 2023. Soil Health. Accessed July 6, 2023.
Publication date: Jan. 31, 2024
AG-439-85
N.C. Cooperative Extension prohibits discrimination and harassment regardless of age, color, disability, family and marital status, gender identity, national origin, political beliefs, race, religion, sex (including pregnancy), sexual orientation and veteran status.