
Some of the most important decisions for soybean production in North Carolina are made at planting. Planting decisions depend on a number of factors including soil texture, planting date, tillage practices, cropping rotation, equipment availability, and grower preferences. When thinking about planting, growers should consider planting date, row spacing, seeding rate, and seed treatments. Also, proper seeder calibration and maintenance should not be overlooked.
Planting Date
Planting date is one of the most important agronomic decisions affecting soybean yield, with earlier planting dates typically resulting in more main stem nodes and subsequently higher yields (see "The Best Soybean Planting Date" [PDF, 1,175 KB]). However, the great diversity of soil types, weather conditions, and rotations encountered across North Carolina result in a wide range of soybean planting dates. Growers in this state start planting soybeans in late March and some do not finish planting until mid-July.
Vegetative growth on soybean plants ‘builds the factory’ to drive photosynthesis and ultimately fill seed (see "The Soybean Growth Cycle: Important Risks, Management and Misconceptions" [PDF, 1,613 KB]). Planting date directly impacts the number of days of vegetative growth to drive photosynthesis prior to flowering. Controls of soybean flowering are described in detail in "Soybean Flowering Fallacy" (PDF, 574 KB) from the University of Wisconsin-Madison. As planting dates are delayed past the optimum, yield reductions are expected due to less time for vegetative growth prior to flowering. Historical recommendations from North Carolina have emphasized the importance of getting the soybeans to a height of 3 feet and canopy closure prior to flowering. We know the maturity group and planting date interact to affect canopy height, and if a planting date and maturity group combination is used that does not allow for canopy closure (lapped middles), soybean yield can decline (Figure 5-1).
Soybean planting date and maturity group (MG) interact to impact soybean yield. A recent analysis of 877 North Carolina soybean yield contest entries from 2002 to 2019 indicated that planting before mid-May and using maturity groups ≤4 increases yield in high yielding situations (see “Key Management Strategies to Increase North Carolina Soybean Yield: What We Have Learned From 877 Soybean Yield Contest Entries”). Further investigation into the impact of these management strategies on yield across more diverse production environments is important, as most of our fields in this state encounter more stress than would an entry into the NC Soybean Yield Contest. The NC Soybean Extension program has been investigating the impact of planting date and maturity group on soybean emergence, flowering, yield, seed damage, purple seed stain, protein, and oil for the past 3 years (2019 to 2021). In each environment, we have evaluated maturity groups 2 to 7 at planting dates from mid-March through mid-July. More details about the methods used in this study can be obtained in "Maximizing soybean yield by understanding planting date, maturity group, and seeding rate interactions in North Carolina" (PDF, 1,868 KB).
Our current dataset has 11 environments across North Carolina from 2019 to 2021 (Table 5-1). Working with a statistician and scouting the trends across individual environments, we have pooled the data into high and low yield environments (Figure 5.2). High yield environments have a site average >60 bu/A. This research will continue in 2022 and 2023 with the ultimate goal of creating a grower decision support tool that will allow growers to enter their planting date and the tool will generate a prediction on the best maturity group and seeding rate combination to use at that planting date.
Table 5-1. Yield environment, County, year, and mean yield for the 11 environments across North Carolina from 2019 to 2021.
| Yield Environment | County | Year | Mean Yield (bu/A) |
|---|---|---|---|
| High | Currituck | 2019 | 66 |
| High | Beaufort | 2020 | 66 |
| High | Rowan | 2020 | 62 |
| High | Edgecombe | 2021 | 71 |
| High | Washington | 2021 | 66 |
| Low | Sampson | 2019 | 44 |
| Low | Union | 2019 | 57 |
| Low | Yadkin | 2019 | 42 |
| Low | Robeson | 2020 | 60 |
| Low | Union | 2021 | 48 |
| Low | Yadkin | 2021 | 57 |
Planting Date: In high yield environments, yields were typically highest with early to mid-May planting for most maturity groups (Figure 5-1). Yields were slightly lower when planting before May and in late May. Yield declined considerably when planting dates were pushed past May and beyond at these higher yield environments for all maturity groups (Figure 5-2).
In low yield environments, yields were highest for most maturity groups when planting from late April to late May. Considerable yield declines were observed when planting before mid-April and after mid-June at these environments (Figure 5-1). Yield declines from planting before mid-April at these environments are not well understood but may be attributed to soil type interactions with cooler weather limiting vegetative growth prior to soybeans moving into reproductive development and also seed damage encountered later in the season with earlier maturing varieties planted early.
There are risks to planting soybeans earlier than May in North Carolina that must be considered and mitigated when possible through adapted management (see “The Best Soybean Planting Date” [PDF, 1,175 KB]). However, there are also yield declines expected when soybean planting is pushed past late May. Soybean producers in North Carolina should strive to have their full season soybeans planted before June and their double crop soybeans planted as soon as possible after small grain harvest.
Row Spacing
A wide range of row spacings have been used successfully in North Carolina soybean production. Often, row spacing decisions are made based on what equipment is already available. Narrower row spacing allows for quicker canopy closure and greater light interception, helps block light from reaching weeds, minimizes moisture loss, and in some circumstances will increase soybean yield. The yield benefit from using narrow rows is more pronounced when the time from emergence (VE) to pod set (R3) is shortened, such as when planting at later planting dates, when using earlier maturing varieties, and at high temperatures. See "How to Pick the Right Soybean Row Spacing" (PDF, 1,419 KB).
In a recent analysis of 877 NC soybean yield content entries, row spacing did not impact soybean yield. This is consistent with a recent analysis of management practices on soybean yield in 3,568 producer fields in the Upper Midwest, which determined no influence of row spacing on soybean yield (see “Benchmarking Soybean Production Systems in the North Central US” [PDF, 4.5 MB]). This data indicates that row spacing typically has minimal impact on soybean yield when other optimum production practices are employed—for example, on-time planting, effective weed management, and no limiting soil moisture (see "How to Pick the Right Soybean Row Spacing" [PDF, 1,419 KB]).
In contrast, small-plot research in North Carolina has often shown yield advantages from narrow (15 in-20 in) versus wider (30 in-42 in) row spacing (Figure 5-3). When row spacing was investigated in small-plots in MG III and IV production across the state in 2018 and 2019 at May planting dates, 15 inch row spacing yielded 7 bu/A more than 30 inch row spacing on average. Producers entering the SYC are typically using earlier-than-average soybean planting dates, which may negate the positive impact of narrower row spacing on yield observed in recent small-plot research (see “Managing Early Maturing Soybeans in North Carolina [PDF, 1,014 KB]). Also in producer fields, wheel-track damage from pest management can lead to 1% to 5% yield declines in narrow rows not typically observed in small-plot research due to differing methods of pest management between producer fields and these plots (see “Wheel Traffic to Narrow-Row Reproductive-Stage Soybean Lowers Yield”).
A more important potential benefit of investing in a narrower row planter for soybean planting in North Carolina would be to facilitate soybean planting simultaneously with other row crops to ensure soybeans are planted early enough to maximize yield.
Seeding Rate
Soybean yield is relatively insensitive to plant population.
Soybeans have the unique ability to compensate, therefore a wide range of seeding rates is acceptable. Final stands as low as 50,000 plants for May planted beans, 75,000 plants for June planted beans, and 100,000 plants for July planted beans can produce reasonable yields if plants are evenly distributed.
Figure 5-4 represents the results of 64 tests planted in 15-inch rows in May, 73 tests planted in June, and 11 tests planted in July. The tests were repeated four times at each location, so the lines on the graph represent the results of 256 tests planted in May, 292 tests planted in June, and 44 tests planted in July. Planted in May, 50,000 plants per acre yielded essentially as high as 175,000 plants per acre, and anything in between. Yields were lower when planted in June, as expected, but the yield pattern for the June planting date (solid line) looks quite like the May line. Even the July line (dotted line) doesn’t look much different from the other two lines.
Figure 5-4 does a better job of helping farmers decide whether they need to replant a poor stand than to decide how many seeds per acre to plant. The graph indicates it is not necessary to replant a field that has 75,000 good plants per acre left, but farmers may be justified in absorbing the cost of replanting for peace of mind. Farmers can also use the graph to determine their minimum acceptable plant population before deciding to purchase “insurance” in the form of extra seed. There’s no reason that farmers should agree on how much of that “insurance” they want to buy.
Because soybean seed size varies among varieties and even within the same variety, planting rates should be considered in terms of plants per foot of row, not pounds per acre. Two plants per foot of row in a 7-inch row is very close to 150,000 plants per acre. That’s what the vertical line to the right side of Figure 5-4 represents. One plant per foot of 7-inch row is 75,000 plants per acre, which is what the vertical line to the left side of the graph represents. For most farmers, two plants per foot of 7-inch row looks pretty sparse, while 10 plants per foot of 35-inch row looks pretty generous, even though both are 150,000 plants per acre. Table 5-2 is useful for calculating the number of seed and plants needed per foot of row for desired populations.
Table 5-2. Number of Seed and Plants Needed per Foot of Row
| Row Spacing (in.) | Row Feet/Acre | MAY PLANTING | JUNE PLANTING | JULY PLANTING | |||
|---|---|---|---|---|---|---|---|
| Seeds/ Row Ft. |
Plants/ Row Ft. |
Seeds/ Row Ft. |
Plants/ Row Ft. |
Seeds/ Row Ft. |
Plants/ Row Ft. |
||
| 36 | 14,520 | 7.8 | 7 | 10.2 | 9.5 | 13.3 | 12 |
| 30 | 17,424 | 7.1 | 6.4 | 9.2 | 8.25 | 11.2 | 10.1 |
| 20 | 26,146 | 5.4 | 4.9 | 6.5 | 5.9 | 7.7 | 6.9 |
| 15 | 34,484 | 4.3 | 3.9 | 4.9 | 4.6 | 5.9 | 5.3 |
| 7 | 74,674 | 2.2 | 2 | 2.5 | 2.25 | 2.8 | 2.5 |
The recommendations in Table 5-2 assume that half a stand will still exceed the population that would require replanting. Farmers should feel free to adjust (up or down) how much extra seed they want to buy as insurance against having to replant. To determine how many plants/row ft are needed for a given population, simply divide the desired plants/ac by the row ft/ac.
Aim for final stands of 75,000 plants for May planted beans, 90,000 plants for June planted beans, and 100,000 plants for July planted beans. Table 5-3 can be used to calculate the number of seeds needed per acre, based on expected percent germination of the seed.
Table 5-3. Seeds Needed per Acre Based on Germination Percentage
| % Germination | Final Stand (Plants/Acre) | ||
|---|---|---|---|
| May Planting (75,000) |
June Planting (90,000) |
July Planting (100,000) |
|
| Seeds/Acre | |||
| 90% | 83,333 | 100,000 | 111,111 |
| 85% | 88,235 | 105,882 | 117,647 |
| 80% | 93,750 | 112,500 | 125,000 |
| 75% | 100,000 | 120,000 | 133,333 |
| 70% | 107,143 | 128,571 | 142,857 |
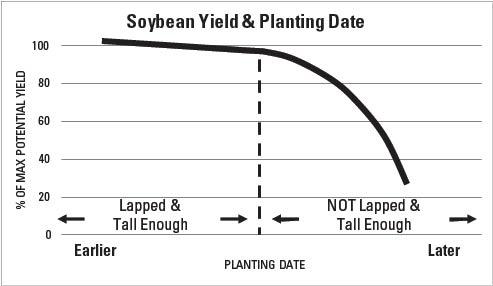
Figure 5-1. Relationship between yield and planting date in soybeans.
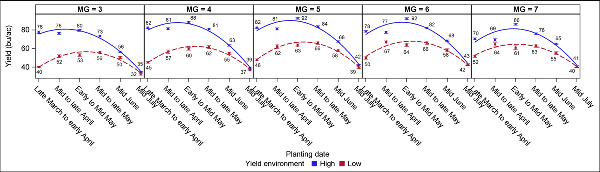
Figure 5.2. The impact of planting date and maturity group on soybean yield in high (n=5, blue) and low (n=6, red) yield environments across North Carolina from 2019 to 2021.
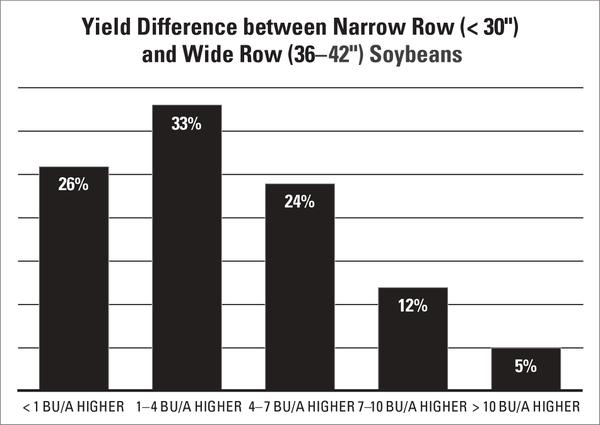
Figure 5-3. Yield difference between narrow row (< 30 inches) and wide row (36 to 42 inches) soybeans.
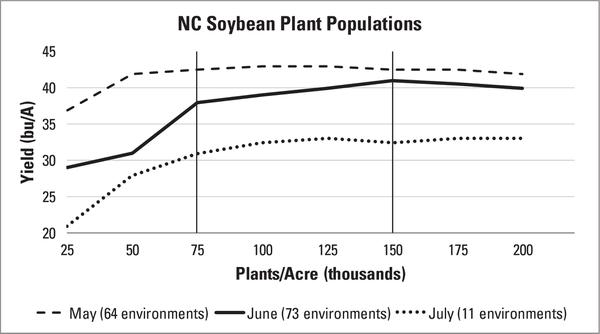
Figure 5-4. Relationship between soybean yield and plant populations.
Planting Depth
Soybean seeds need to be planted deep enough to get good seed-to-soil contact and shallow enough that they don’t expend more energy to get out of the ground than necessary—usually about ¾ to 1¼ inches deep. If using a pre-emergence broadleaf herbicide (especially a metribuzin), a depth of 1½ to 2 inches deep is recommended to decrease the likelihood that the soybean seedling will take up the herbicide. If planting no-till, be sure the seed are in contact with the soil, not just the residue on the soil surface.
Southern soybean varieties will emerge from deeper depths than listed in the previous paragraph, but the deeper the planting depth, the weaker the seedling will be when it emerges. It is probably better to plant too deep (at the risk of a weaker seedling at emergence) than too shallow (at the risk of not getting good contact of the seed with the soil, so moisture can get to the seed). If planting depth is not very uniform (as with planting with a drill), make sure that most of the seeds are deep enough to get covered with some soil, even though other seeds will likely be planted deeper than recommended.
Seed Treatments
Fungicide seed treatments: Soybeans in North Carolina are susceptible to several early-season pathogens (see “Soybean Seedling Diseases”). These pathogens are most effectively managed using a diversity of strategies including varietal resistance, cultural tactics, and chemical control options. Active ingredients in fungicide seed treatments have different activity on seedling diseases encountered in NC soybean production and information on fungicide efficacy on soybean seedling diseases can be found in “Fungicide Efficacy for Control of Soybean Seedling Diseases” (PDF, 2,020 KB) from the Crop Protection Network. As growers prepare to plant soybeans, the question arises about whether fungicidal seed treatments are needed to protect soybean stand and ultimately yield. Research from 2014 to 2018 across 15 North Carolina environments showed there was no impact of a fungicidal seed treatment on soybean yield when soybeans were planted after mid-May (see NC State Extension publication AG-860, Nonfoliar Yield Enhancement Products in North Carolina Soybeans). However, more recent small-plot and strip-plot research conducted in North Carolina indicates that a fungicidal seed treatment can have value for protecting stand and yield at planting dates earlier than mid-May in environments where disease pressure and varieties used are conducive for disease development (see “What is the Value of a Fungicide Seed Treatment in NC Soybean Production?”). We encourage scouting and subsequent diagnosis of soybean seedling diseases using the NC State Plant Disease and Insect Clinic, as this can aid in the future selection of effective seed treatments for the various seedling diseases in that field and can inform variety selection for varieties with resistance to the identified seedling diseases in the future.
Insecticide seed treatments: Soybean insecticide seed treatments do not provide a yield benefit in North Carolina, or most of the area where soybean is grown. Out of 26 replicated Extension tests across North Carolina, we have never measured a yield advantage to using insecticide seed treatments (see “Neonicotinoid soybean seed treatments provide negligible benefits to US farmers” [PDF, 2.5 M]). While insecticide treatments kill soybean pests, such as thrips, the pests are not at levels that are high enough to cause yield loss (see “Impact of Neonicotinoid Seed Treatments on Thrips (Thysanoptera: Thripidae) and Soybean Yield in Virginia and North Carolina”). Fingers are commonly pointed at thrips, which can pucker and silver leaves at high densities (see “Thrips in Soybean”). In two 2012 trials, we had thrips numbers in untreated plots that averaged over 50 and 38 per plant, respectively, in untreated plots compared with various insecticides, including Temik (aldicarb). Even at these densities (which could kill small cotton seedlings), we did not see differences in yield. Bean leaf beetle is another common target. However, numbers are too low when soybeans are seedlings to cause enough defoliation to lead to yield loss. Not only are soybean insecticide seed treatments an unnecessary expense, their overuse can drive resistance in other crops and can kill predatory ground beetles, releasing slugs that clip plants and reduce yields (see “Insecticide Resistance Signals Negative Consequences of Widespread Neonicotinoid Use on Multiple Field Crops in the U.S. Cotton Belt” and “Neonicotinoid insecticide travels through a soil food chain, disrupting biological control of non-target pests and decreasing soya bean yield”). Unfortunately, we don’t have any remedial management methods to kill slugs. Therefore, skip insecticide on soybean seed when possible.
Nematicide seed treatments: Plant-parasitic nematodes are microscopic roundworms that feed on the roots of the crop plant, causing damage and reduced growth. Management of nematodes (such as soybean cyst nematode [Heterodera glycines] and root-knot nematode [Meloidogyne spp.], among others) requires a multi-pronged plan. This plan should include monitoring of nematode populations, use of soybean varieties with genetic resistance to the nematodes of concern where available, and chemical options including nematicide seed treatments where appropriate. What are nematicide seed treatments? Nematicide seed treatments are chemical or biological compounds with nematode-killing properties applied to the seed before planting. These seed treatments are designed to provide early season protection, guarding young plants during an early growth period. Nematicide seed treatments are most beneficial under low to moderate nematode pressure. Fields with high or heavy levels of nematode pressure are unlikely to be successfully managed through seed treatment alone. What nematicide seed treatment options are available? Several products are available including biological-based and conventional chemistry-based (Table 5-4). Additional information of seed treatments for soybean and other crops is also available in the current North Carolina Agricultural Chemicals Manual. Please refer to the current chemical labels in all cases for directions on safe use and information on application rates, timing, and harvest intervals.
Table 5-4. Nematicide formulation, trade name, rate, and nematodes targeted with various nematicide seed treatments.
| Nematicide formulation and Trade Name | Rate | Nematodes targeted |
|---|---|---|
| Pasteuria nishizawae (Clariva pn)
|
1 to 3 oz. per 100 lbs seed
|
Soybean cyst nematode
|
| Bacillus fermis (Poncho/Votivo)
|
1.02 fl. oz. per 140,000 seeds
|
Soybean cyst nematode, Root-knot nematode, Reniform nematode
|
| Bacillus amyloiquefaciens (Aveo EZ)
|
0.1 fl. oz. per 140,000 seeds
|
Soybean cyst nematode, Root-knot nematode, Reniform nematode
|
| Fluopyram (Ilevo)
|
0.6 to 1.97 fl. oz. per 140,000 seeds
|
Soybean cyst nematode, Root-knot nematode, Reniform nematode, Other nematodes
|
| Abamectin (Avicta 500 FS)
|
0.10 to 0.15 mg per seed
|
Soybean cyst nematodes, Other nematodes
|
Inoculant seed treatments: Soybeans form a symbiotic relationship with bacteria in the soil, which allow the bacteria to fix atmospheric nitrogen into plant available nitrogen and in return provide the bacteria with energy. Inoculant seed treatments. introduce bradyrhizobia (the bacteria that convert atmospheric nitrogen into plant useable forms of nitrogen) into the soil. Seed treatment inoculants do not seem to be as effective as inoculants put in the furrow with the seed. Apparently, it is difficult to get enough bacteria to stick to the seed, but it’s not so hard to get enough bacteria into the furrow with the seed. Research from decades ago in North Carolina tested inoculant materials on NC fields that had not produced soybeans in the previous eight years or more resulted in a yield response in only two of the 23 locations evaluated. The yield response from the two sites, however, was enough to return double to triple the money invested in inoculating all 23 sites. Of the two sites that produced a yield response, one was in the sandhills (Moore county) and one was in the blacklands (Tyrrell county). Interestingly, the 17 inoculant materials tested ranked in almost the identical yield order at both sites. The seven inoculants that produced the highest yields, at both sites, were all soil-applied inoculants. The seven inoculants that produced the lowest yield response, at both sites, were all seed-applied inoculants. A common recommendation, in both the South and the Midwest, is to inoculate any field that has not produced soybeans in the previous four to five years. This treatment may not be necessary, but a farmer cannot afford to not inoculate the one field out of many that needs to be inoculated.
More recent research from across the United States indicated that seed applied nor soybean applied inoculants increased soybeans yield in fields with a history of soybeans or that were not under severe stress. In the North Carolina Soybean Yield Contest analysis, inoculating soybeans was not a strong predictor of high soybean yield, even in high yielding environments (see “Key Management Strategies to Increase North Carolina Soybean Yield: What We Have Learned From 877 Soybean Yield Contest Entries” and “Soybean yield, biological N2 fixation and seed composition responses to additional inoculation in the United States”).
Seeder Calibration and Maintenance
It is essential to properly maintain planting equipment before going to the field. An improperly prepared planter or drill will be more difficult to calibrate, may not deposit the seed correctly in the furrow, and may be prone to breakdown in the field during planting. The best source of information on planter or seeder maintenance and preparation will be the operator’s manual that came with the implement. If you do not have a manual, contact the equipment manufacturer. Even for older implements, they can often provide an operator’s manual.
Maintenance and Preparation
Most implements have several areas in common that the owner or operator should focus on:
Seed hopper—Check the hopper for leaks and damage. Small holes in the hopper bottom or side wall will allow seed to fall through, resulting in seed loss. Check the inside of the hopper for corroded areas or blockages. Anything that impedes the flow of seed from the hopper can affect planting performance.
Seed meter—Whether it’s seed plates for drums in a row crop planter or seed wheels in a drill, the metering mechanism is responsible for measuring the seed rate and insuring correct population. Inspect the metering mechanism carefully for damage. For row crop planters, make sure you have the correct plate for the seed you have selected. A mismatch can lead to excessive skips or doubles.
Air delivery—If you are using an air planter, pressure, or vacuum, check the air delivery and pressure at the seed meter. Most systems have a pressure gauge on the common air tube near the fan. Adjust the air pressure to match the recommendation for the size and type of seed you are planting. Check the air pressure and delivery at the metering unit as well. A blockage in the air tube between the metering unit and the pressure gauge at the fan will affect the air delivery.
Meter Drive—The seed meter is typically driven by one of three mechanisms:
- Press wheel—Press wheel drives have a drive chain from the row press wheel that provides power to turn the seed meter. This is often found on older planters. Check the condition of the chain and sprockets for each unit. Check the wheel and drive bearings to make sure the press wheel turns freely.
- Drive wheel—Many planters use a drive wheel on the planter frame to deliver power to a countershaft. Individual seed meters take power from this shaft. In this system, multiple rows are all driven at the same rate. On larger units, there may be more than one drive wheel. In this case, each wheel provides power to a section of row units or seed meters. Check the condition of the chains and sprockets to smooth performance. Check the bearings for smooth rotation. You should also check the drive wheel carefully. If the tire is the wrong size, is badly worn, or the air pressure is incorrect, there may be a significant error in seed population during planting. Air pressure in the tire can change at any time due to leaks, punctures, or other damage. Check the inflation pressure often.
- Hydraulic drive—Hydraulic drives take the place of press wheel or drive wheel systems on some planters. The hydraulic drive is controlled by an automatic rate controller in the tractor. Drive speed is calibrated to true ground speed by the rate controller. Check the system pressure and adjust the flow delivery as recommended by the planter manual. Check for proper drive speed calibration at the start of each season. Monitor its performance as you plant. Be sure to keep all hydraulic connections clean. Dirt is the worst enemy of a hydraulic system. The quick connects between the tractor and the implement are an easy point of entry for dirt in the hydraulic system.
Preseason maintenance is the key to successful planting. Your preseason preparation can be made easier by practicing good maintenance when you finish planting for the season. Put the planter up ready to go or stored as recommended by the manufacturer, and your task at the beginning of the planting season will be much simpler.
Calibration
Calibration is the process of proving the planter or drill is delivering the seed at the rate intended. You should not assume the rate charts provided by the manufacturer in the manual will be exact for every application. Those charts represent what the manufacturer perceives to be average or representative conditions across a wide range of planting environments. Changes in seed properties, field condition, equipment condition and a host of other factors can influence the result. To ensure successful planting, be sure to calibrate your planting equipment.
Calibrating a Row Crop Planter
Row crop planters typically singulate individual seed. As such, calibration is often based on seed spacing in the furrow or seeds per foot of row length.
- Determine the seed rate. Seed rate is the number of seed to plant per acre. It takes into account the germination percentage for the seed used and the emergence percentage. Germination percentage is usually on the seed label. Emergence may be available for specific areas or conditions.
\( Seed\ Rate,\frac{seed}{acre}=\ \frac{Plant\ Population}{\%\ Germination\times\%\ Emergence} \) - Seed spacing. Calculate the seed spacing in seeds per foot of row. To do this, you will need to know the row spacing you will use and the seed rate calculated above.
\( Seed\ Spacing,\frac{seed}{ft}=\frac{Seed\ Rate,\frac{seed}{acre}\times R o w\ Spacing,\ inches}{43,560\ sq\ ft\ per\ acre\times12\frac{inches}{foot}} \)
Alternatively, your manual may use a planting table with spacing quoted in inches per seed.
\(Seed\ Spacing,\frac{inches}{seed}=\frac{43,560\ sq\ ft\ per\ acre\times144\ sq\ in.\ per\ sq\ ft}{Seed\ Rate,\frac{seed}{acre}\times R o w\ Spacing,\ in.} \) - Set your planter up as indicated in the manual. If you are using a planter with a ground drive system to power the seed meter, use the chain and sprocket combinations recommended in the planter manual. If you are using a hydraulic drive, set the drive speed and pressure as indicated in your manual.
- Fill the hopper with enough seed to give you smooth seed feeding into the meter. If using an air planter, set the air pressure as recommended.
- Run the planter at the recommended speed for several feet to get the meter filled and delivering seed to the ground. Check the seed spacing in the furrow and compare it to the spacing you calculated, either seed per foot of row or seed per inch. You may want to disengage the furrow closing wheel to make measurement easier. Also, make a “dry” run with the planter positioned just low enough to engage the drive. Note that this may not accurately represent field conditions.
- To measure seed per foot, measure a length of row several feet long. Count the number of seed present in that space and divide the count into the distance measured. The result is seed/ft of row.
- To measure inches per seed, pick a section of seed in the furrow and measure from the first seed to the last seed. Divide this measurement by the number of spaces between seed in the measured distance. The result is inches/seed.
- Compare your spacing to the spacing necessary to achieve the population you want. If your spacing is too high or too low, make the necessary drive adjustments to correct the spacing.
Calibrating a Grain Drill
Grain drills meter seed by volume, not by singulating each seed. While not as precise as a row crop planter unit, they are effective at establishing a uniform plant population when properly calibrated. Grain drills can be calibrated by counting the seed dropped in the calibration test or by weighing the seed.
- Mark off a calibration distance in an area representative of field conditions. You can use a distance of 100 to 200 feet in one of the fields to be planted. Longer distances give more accurate calibrations but require you to handle more seed.
- Drive the calibration distance with the seed hopper half full and the seeding mechanism disengaged. Count the number of revolutions the drill drive wheel makes to cover this distance. You can mark the drive wheel with paint, tape, or something to make it easy to count revolutions. You should drive the test distance at least twice, once in each direction, to get the average count.
- Set the drill drive mechanism for the rate you want to achieve. Look at the seeding chart in the hopper or in the owner’s manual, and choose the seed type from the chart. If your seed is not listed, pick something close to its size for a first run. Make the necessary adjustments to the drive mechanism.
- To collect seed during calibration, you can spread a large tarp on the ground or shop floor to catch the seed. You could also place a bucket under each seed tube and catch the seed discharged.
- With the drill hitched to the tractor, engage the seeder drive mechanism and turn the drive wheel by hand for the number of revolutions counted in step 2 above. You may need to use a jack or some blocks to safely position the drill and still allow you to turn the drive wheel.
- After collecting the seed for the number of turns required, combine all seed in a container and weigh the seed. If a scale is not available, you can count the seed and compare the result to a population chart.
- Seed per acre is determined from the weight of the seed collected and the area used for calibration. Area is determined from the drill swath and the calibration distance used.
\( Seed\ per\ Acre,\ \frac{lb}{ac}=\ \frac{Weight\ of\ Seed\ Collected,\ lb\times43,560\ sq\ ft\ per\ acre}{Calibration\ Distance,\ ft\times D r i l l\ Swath,\ ft} \) - Pounds per acre of seed can be converted to number of seeds per acre if you know the number of seeds per pound for the variety planted.
\( Number\ of\ Seed\ per\ Acre=\ Seed\ per\ Acre,\frac{lb}{ac}\times\frac{Seed\ Count}{lb} \) - Compare the seeding rate achieved by the drill to the population target you want to achieve. Adjust the drive mechanism accordingly to zero in on your population target.
Variable Rate Planting
Variable rate planting or seeding can be used effectively to optimize productivity in each field. In variable rate planting, seed populations are adjusted on the fly by a variable rate control system while planting in the field. Population changes or prescriptions can be based of soil type maps, previous yield maps, management zones, or other attribute maps.
To make variable rate planting work, you will need several pieces of precision agriculture technology:
- GPS/GNSS receiver—The receiver will determine field position at any time you are in the field. It is necessary to determine your position when reading and planting prescription from a map.
- Field computer—Also called a field display, the field computer is responsible for reading the position information as well as the prescription map and sending the seed rate information to the variable rate controller. Some field computers or displays have the GPS/GNSS receivers built in, others require external receivers.
- Variable rate controller—The rate controller is often a part of the field computer or may be an added module. It takes the rate calculation from the field computer and converts it into a control signal for the variable rate drive.
- Variable rate drive—The rate drive is a hydraulic or electric motor that turns the seed metering mechanism. Hydraulic drives typically power several row units. Electric motors are often mounted on individual row units and provide individual control.
- Prescription map—The prescription map contains the rate information. As you move from one zone to another, the prescription map is where specific rate information, such as the seed population, and in some cases, the variety to be planted will be. This is the information read in the field to achieve variable rate.
The advantage variable rate planting offers is the ability to match seed populations or varieties to specific areas in the field. Many farmers have fields with variable soil types or some parts of a field consistently perform better than others. With variable rate planting, you can put the population or variety in each part of the field that matches its yield potential.
Publication date: April 29, 2022
AG-835
Other Publications in North Carolina Soybean Production Guide
- The Soybean Plant
- Soybean Production and Marketing in North Carolina
- Rotational Considerations
- Variety Selection
- Planting Decisions
- Fertilization and Nutrient Management
- Weed Management
- Disease and Nematode Management
- Insect Management
- Key Management Strategies to Increase North Carolina Soybean Yield: What We Have Learned From 877 Soybean Yield Contest Entries
- Harvesting, Drying, and Storage
- Soybean Facts
Recommendations for the use of agricultural chemicals are included in this publication as a convenience to the reader. The use of brand names and any mention or listing of commercial products or services in this publication does not imply endorsement by NC State University or N.C. A&T State University nor discrimination against similar products or services not mentioned. Individuals who use agricultural chemicals are responsible for ensuring that the intended use complies with current regulations and conforms to the product label. Be sure to obtain current information about usage regulations and examine a current product label before applying any chemical. For assistance, contact your local N.C. Cooperative Extension county center.
N.C. Cooperative Extension prohibits discrimination and harassment regardless of age, color, disability, family and marital status, gender identity, national origin, political beliefs, race, religion, sex (including pregnancy), sexual orientation and veteran status.